
Figure 1. HOTAIR Is Repressed by Androgen and Is Thus Upregulated in CRPC.
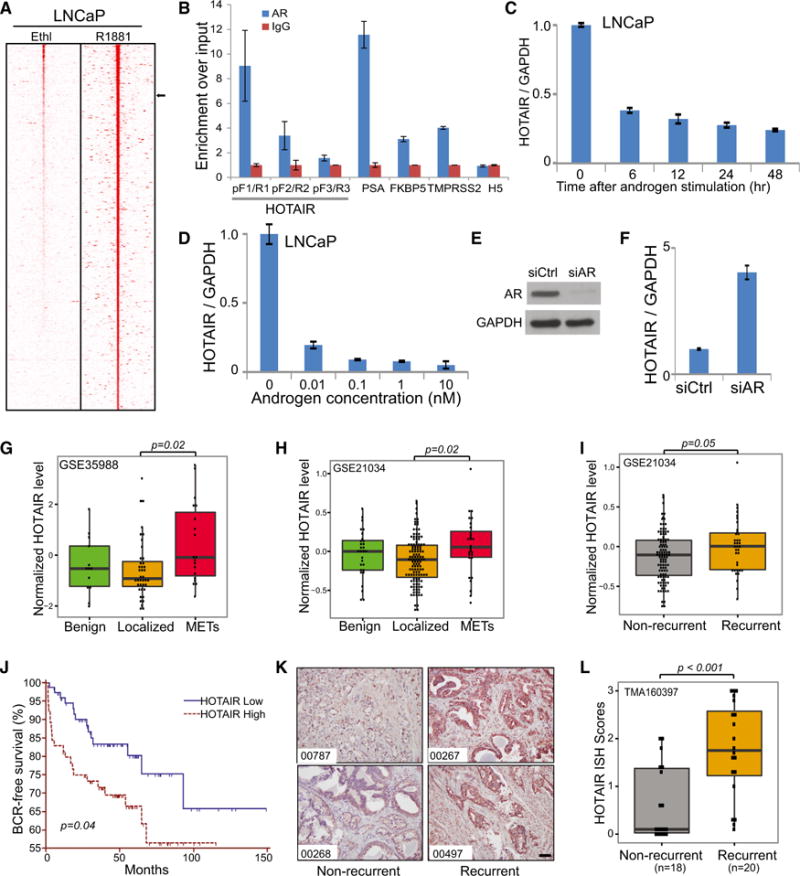
(A) Heatmap showing AR ChIP-seq reads around lncRNAs. Previously published AR ChIP-seq data from ethanol or R1881 (10 nM)-stimulated LNCaP cells were re-analyzed for enrichment around lncRNAs (Table S1). Normalized AR ChIP-seq reads around (±50 kb) lncRNAs are shown. Black arrow on the right denotes HOTAIR.
(B) AR occupies the HOTAIR promoter. AR and IgG ChIP were performed in LNCaP cells and ChIP-qPCR was carried out using primers flanking the HOTAIR promoter regions (see Figure S1B for detail), well-established AR target gene enhancers, and the 3′ end of the HOTAIR gene as a negative control (H5).
(C and D) Androgen inhibits HOTAIR expression. The qRT-PCR analysis of HOTAIR expression in LNCaP cells, stimulated either by 1 nM androgen R1881 over a time course (C) or by different doses of R1881 (D) for 48 hr, is shown. Data were normalized to GAPDH. Data shown are mean ± SEM and representative of at least two independent experiments.
(E and F) AR depletion restores HOTAIR expression. LNCaP cells were treated with control and AR-targeting small interfering RNA (siRNA), confirmed for AR knockdown (E) and subjected to qRT-PCR analysis of HOTAIR expression (F).
(G–I) HOTAIR is upregulated in metastatic prostate tumors. HOTAIR expression in publicly available datasets (GEO: GSE35988 and GSE21034) was comparatively plotted in benign prostate, localized PCa, and metastatic PCa (G and H) or in localized PCa with or without biochemical recurrence (I). Significant p values are indicated.
(J) High HOTAIR level is associated with poor clinical outcome. Kaplan-Meier analysis of PCa outcome using the GEO: GSE21034 dataset is shown. Localized PCa cases were stratified based on their HOTAIR expression level and analyzed for biochemical recurrence. The p values for Kaplan-Meier curves were determined using a log-rank test.
(K and L) The lncRNA ISH was performed using a tissue microarray of recurrent versus non-recurrent PCa. ISH HOTAIR staining in two representative cases of recurrent and non-recurrent PCa is shown (K). Scale bar, 100 μm. HOTAIR ISH staining intensity was scored in all cases, compared between two groups (p < 0.001 by t test), and visualized by boxplot (L).