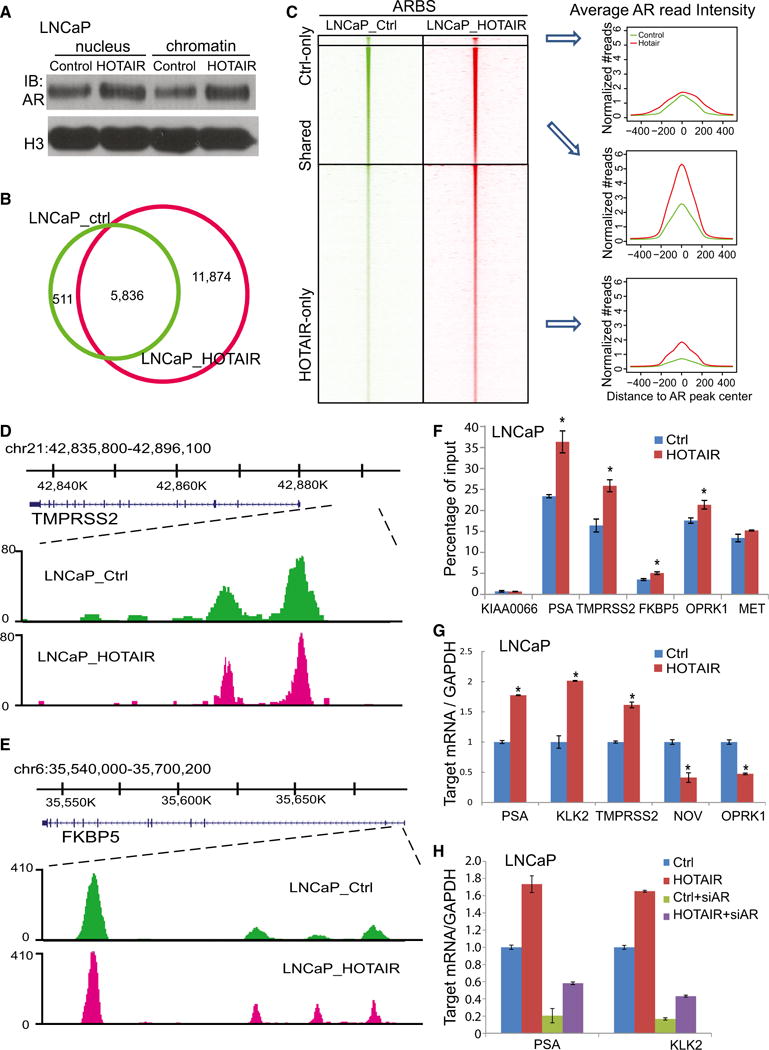
Figure 4. HOTAIR Expression Enhances AR Transcriptional Activity.

(A) Nuclear and chromatin-bound fractions of AR protein in control and HOTAIR-overexpressing LNCaP cells. H3 was used as a loading control.
(B) Overlap of AR-binding sites (ARBSs) detected by ChIP-seq in LNCaP cells with control (LNCaP_ctrl) or HOTAIR overexpression (LNCaP_HOTAIR) is shown.
(C) Heatmap depicting AR ChIP-seq read intensity around (±5 kb) ARBSs detected in control only, HOTAIR-overexpressing LNCaP cells only, or both. Average AR ChIP-seq read intensity around ARBSs (±500 bp) is shown (right).
(D and E) Genome browser view of ChIP-seq AR-binding events around known AR downstream genes TMPRSS2 (D) and FKBP5 (E) is shown.
(F) ChIP-qPCR analysis of known AR target genes. AR ChIP was performed in LNCaP_ctrl and LNCaP_HOTAIR cells followed by qPCR using primers targeting enhancers of several AR downstream genes. KIAA0066 was used as a negative control. Data shown are mean ± SEM.
(G) The qRT-PCR analysis of AR downstream genes in LNCaP cells with control, HOTAIR overexpression. Gene expression was normalized to GAPDH. Data shown are mean ± SEM.
(H) The qRT-PCR analysis of AR downstream genes in LNCaP_ctrl and LNCaP_HOTAIR cells with control or AR knockdown. Gene expression was normalized to GAPDH. Data shown are mean ± SEM.
