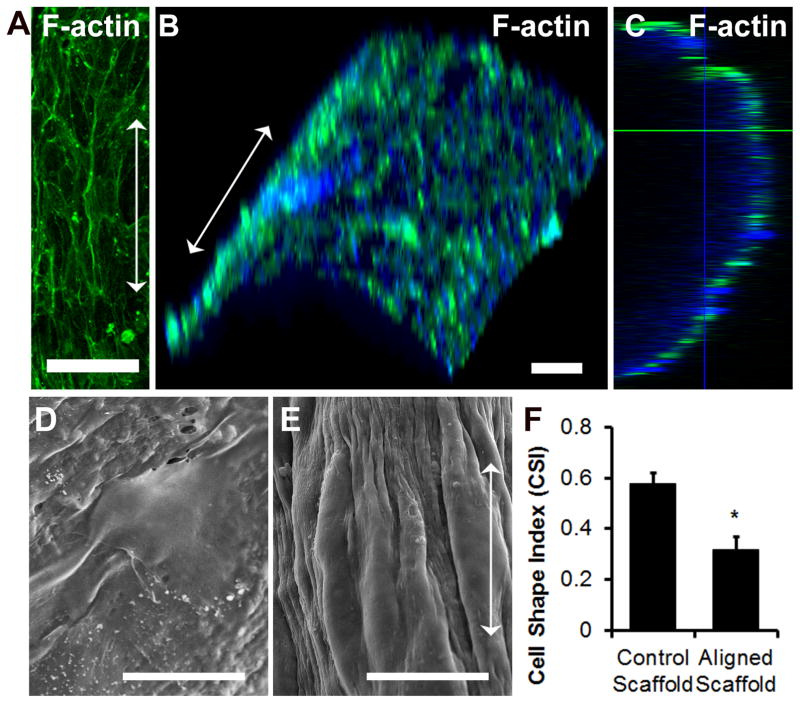
Fig. 2. Endothelial morphology on aligned collagen scaffolds.
(A) Confocal microscopy images of F-actin fluorescent staining on primary human ECs cultured on aligned nanofibrillar scaffolds. (B) Three-dimensionally reconstructed images showing F-actin staining (green) and Hoechst 33342 total nuclei (blue) surrounding scaffold. (C) Orthogonal view of F-actin staining. SEM of primary human ECs cultured on control (D) scaffold or aligned nanofibrillar (E) scaffolds. (F) Quantification of CSI between cells seeded on control or aligned nanofibrillar scaffolds. Arrow denotes direction of collagen nanofibrils. Scale bar: 100 μm (A–B), 20 μm (D–E).

