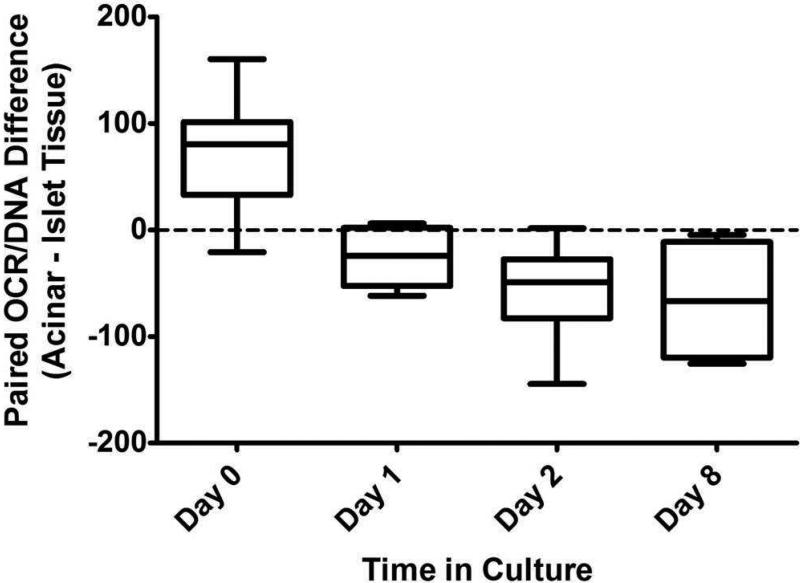
Figure 1.
Box and whisker plot depicting the mean difference in the OCR/DNA values when comparing paired islet and acinar tissue fractions on Day 0, 1, 2 and 8 of culture. Error bars represent minimum and maximum differences. OCR/DNA is significantly higher for acinar (vs. islet) tissue on Day 0, but becomes lower with more time in culture.

