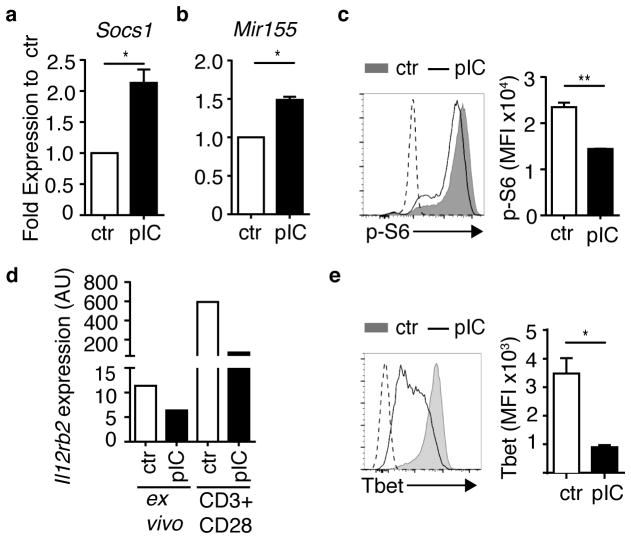
Figure 3. Naïve CD4+ T cells exposed to bystander inflammation exhibit altered molecular pathways that instruct T cell differentiation.
Naïve CD4+ T cells were isolated from PBS (ctr)- or poly(I:C)-treated (pIC) DR mice as described in Supplementary Fig. 3a, and assessed (a,b) ex vivo, (c) after 16 h stimulation with antigen, (d) ex vivo or after 48 h stimulation with plate-bound CD3 plus CD28 without APCs as indicated, or (e) after 3 days stimulation with antigen. (a,b) Expression of (a) Socs1 mRNA and (b) Mir155 in ex vivo purified DR cells. Bar graphs depict expression in DR cells from pIC-treated mice relative to corresponding control DR cells (set to 1), normalized to (a) Rn18s and (b) Sno234 RNA. (c) DR cells were stimulated with OVA(323–339) peptide-pulsed APCs for 16 h, control cells were cultured with no antigen stimulation, depicted by dashed line. DR cells were stained for intracellular phospho-S6 (p-S6), representative flow cytometry histogram (left), mean florescence intensity (MFI) of p-S6 staining (right). (d) DR cells were purified and RNA was extracted from purified DR cells directly ex vivo, or after 48 h of stimulation with plate-bound anti-CD3 and CD28 (CD3+CD28) in vitro. Bar graphs depict Il12rb2 expression in DR cells from pIC-treated mice, normalized to Rn18s RNA. Data are representative of three independent experiments. (e) DR cells were stained for intracellular T-bet after 3 days of OVA peptide stimulation, representative flow cytometry histogram (left), mean florescence intensity (MFI) of T-bet staining (right). Dashed line on histogram indicates unstimulated control cells. (a–e) Data are representative of at least three independent experiments, n ≥ 3 mice per group. Bar graphs depict mean and SEM of triplicate values. P-values by student’s two-tailed t-test, *p<0.01, **p<0.001.

