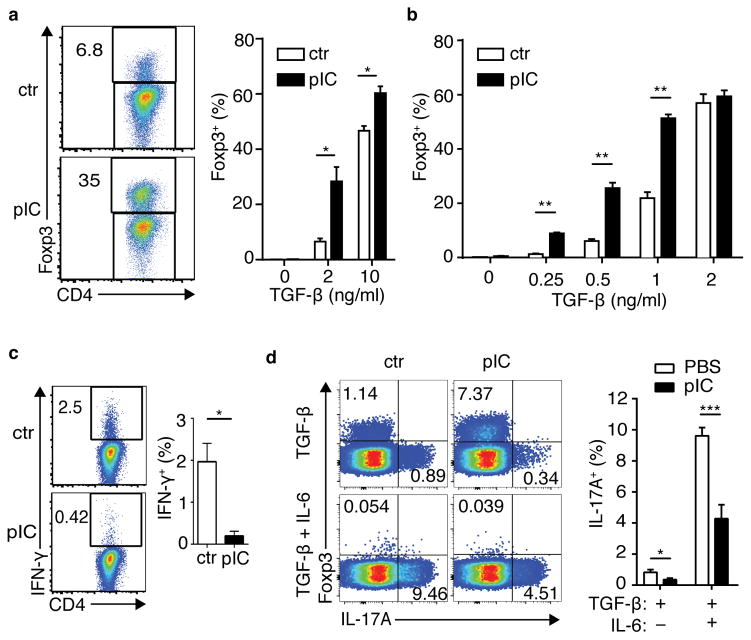
Figure 4. Naïve CD4+ T cells exposed to bystander inflammation are conditioned for enhanced de novo Foxp3+ Treg cell differentiation and reduced effector T-helper cell differentiation.
(a) Spleen and lymph node CD4+ T cells from control (ctr) or poly(I:C)-treated (pIC) DR mice were stimulated for 5 days with APCs pulsed with OVA peptide and TGFβ as shown, then assessed for intracellular Foxp3. Left panels, representative FACS plots; right panel, bar graph of frequencies of Foxp3+ DR cells. (b) Naïve CD4+ T cells from ctr or poly(I:C)-treated Balb/c mice were sorted and cultured with plate-bound anti-CD3+CD28 and TGFβ. Frequency of Foxp3+ CD4+ T cells is shown. (c) DR cells were cultured in non-skewing conditions, then stimulated with PMA+Ionomycin (P/I) and stained for intracellular IFNγ. (d) DR cells were cultured in the presence of TGFβ or TGFβ + IL6, then stimulated with P/I and assessed for intracellular Foxp3 and IL17A. Bar graphs depict mean plus SEM for triplicate values; representative data is shown for three to five independent experiments, n ≥ 3 mice per group. P-values by student’s two-tailed t-test, *p<0.05, **p<0.001, ***p<0.0001.

