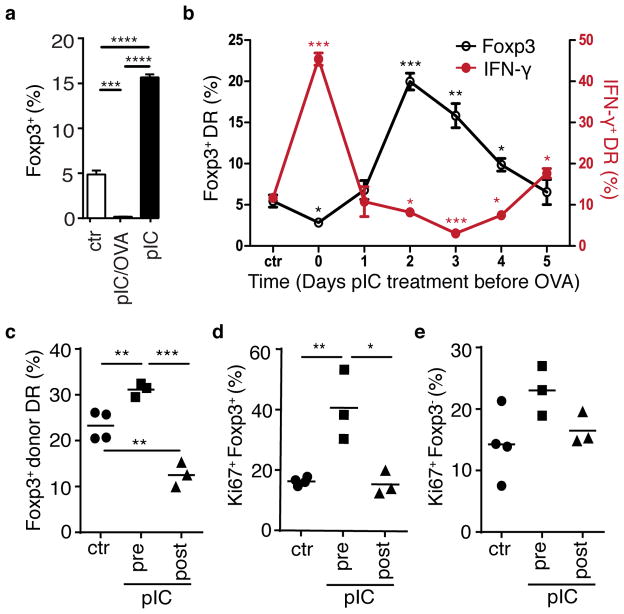
Figure 7. Timing of bystander inflammation relative to antigen signal determines conditioning for regulatory versus effector cell differentiation.
(a) DR mice were treated with pbs (ctr), poly(I:C) alone (pIC), or poly(I:C) and OVA peptide (pIC/OVA) on two consecutive days, and on the third day CD4+ T cells were isolated and cultured with OVA-pulsed APC and TGF β for 3 days. Bar graph depicts % Foxp3+ DR. (b) DR cells were transferred into Balb/c host mice, which were then treated with poly(I:C) at indicated timepoints prior to harvest of spleen and lymph node cells and culture with OVA-pulsed APCs (summarized in Supplementary Fig. 7a). After 5 days, cells were stimulated with PMA+Ionomycin, and intracellular IFN γ (red line) and Foxp3 (black line) were assessed. (a,b) Mean plus SEM shown of triplicate values, data are representative of two independent experiments, n=2 mice per group. P-values as indicated relative to control. (c–e) DR cells were parked in BALB/c host mice, which were treated with pbs (ctr) or poly(I:C) either 2–3 days prior (pIC, pre) or 1–2 days after (pIC, post) addition of OVA protein in drinking water for 3 days. On day 7 after start of OVA feeding, mesenteric LN were harvested and donor DR cells were assessed for (c) frequency of Foxp3+ cells and donor DR expression of Ki67 proliferation antigen in (d) Foxp3+ DR cells and (e) Foxp3-negative DR cells. Each symbol represents data from an individual mouse, data are representative of two independent experiments, n ≥ 6. P-values by student’s two-tailed t-test, *p<0.05, **p<0.001, ***p<0.0001, ****p<0.00001.

