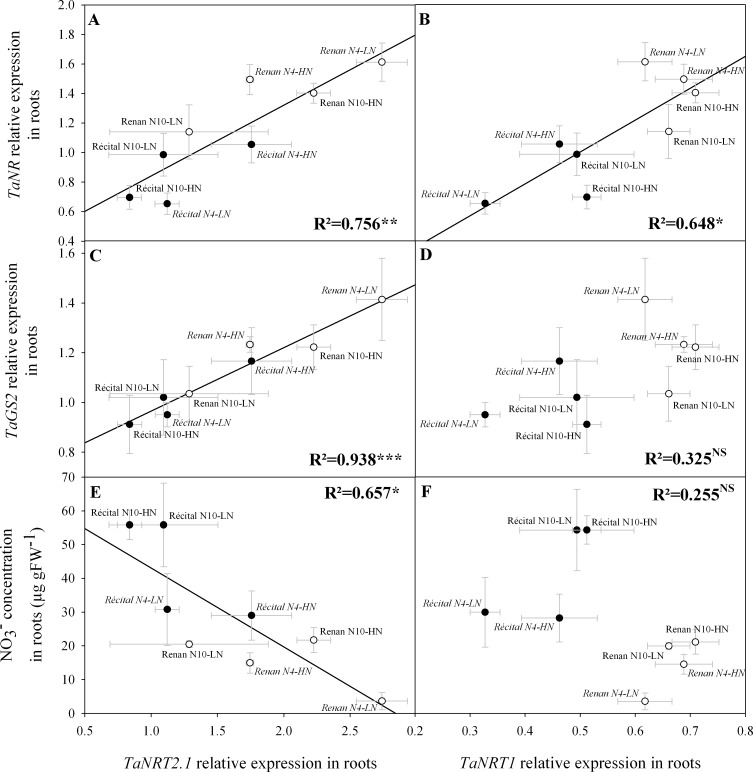
Fig 6. Relations between relative expression levels of genes coding for root nitrate transporters and relative expression levels of genes involved in nitrate assimilation, or nitrate concentration in roots at GS65+250 DD.
Relations are for TaNRT2.1 and TaNR (A), TaNRT2.1 and TaGS2 (C), TaNRT2.1 and root NO3- concentration (E), TaNRT1 and TaNR (B), TaNRT1 and TaGS2 (D), TaNRT1 and root NO3- concentration (F). Values are for Récital (black circles) and Renan (white circles) exposed to two contrasting pre-flowering nitrate treatments N4 (italic labels) and N10 (regular labels) combined with two contrasting post-flowering nitrate treatments LN and HN. Values are the means of five biological replicates ± 1 standard error.

