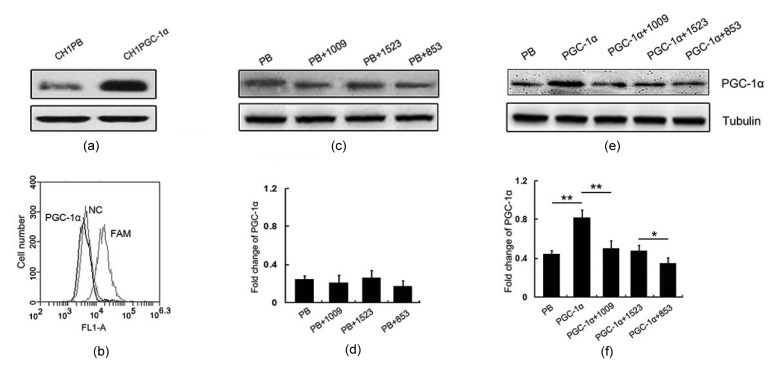
Fig. 2.
Establishment of a stable CH1 cell line expressing PGC-1α and RNA interference
(a) Expression of PGC-1α protein in PB (pBABEneo empty vector) and PGC-1α (pBABEneo-PGC-1α) cell lines; (b) The efficiency of small interference RNA (siRNA) was detected by flow cytometry (NC as non-targeting control and FAM as efficiency detection with fluorescence); (c) Expression of PGC-1α protein in PB and PB cells that were interfered by three siRNA (1009, 1523, and 853); (d) Semi-quantification of PGC-1α protein expression in (c); (e) Expression of PGC-1α protein in PB, PGC-1α, and PGC-1α cells that were interfered by three siRNA (1009, 1523, and 853); (f) Semi-quantification of PGC-1α protein expression in (e). ** P<0.01, * P<0.05. Data are expressed as mean±SD (n=3)

