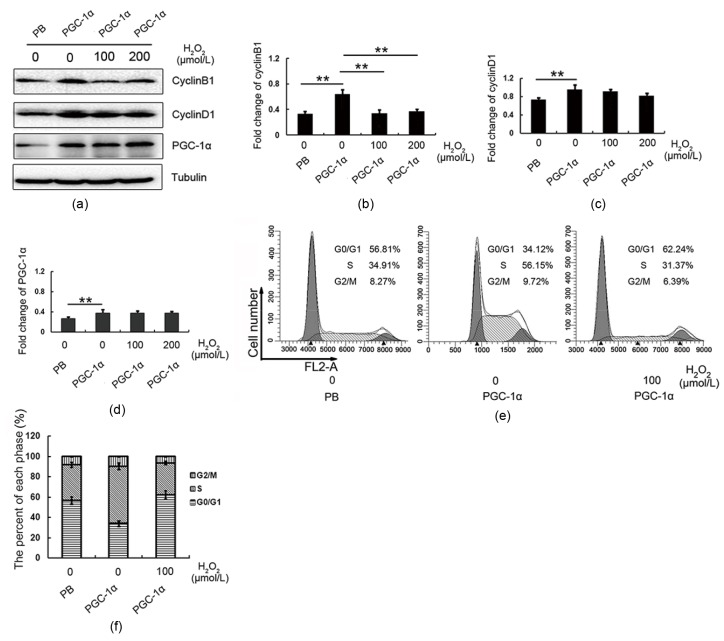
Fig. 6.
Cell cycle profiles and changes in CyclinD1/B1 in CH1-PGC-1α after 5 h of H2O2 exposure
(a) Probe for CyclinB1, CyclinD1, and PGC-1α. PGC-1α cells were exposed to H2O2 (0, 100, and 200 μmol/L). PB served as a control for PGC-1α. Semi-quantification of CyclinD1 (b), CyclinB1 (c), and PGC-1α (d) in (a). (e) Profile of cell cycle. (f) The percentage of CH1 cells in each phase. ** P<0.01. Data are expressed as mean±SD (n=3)

