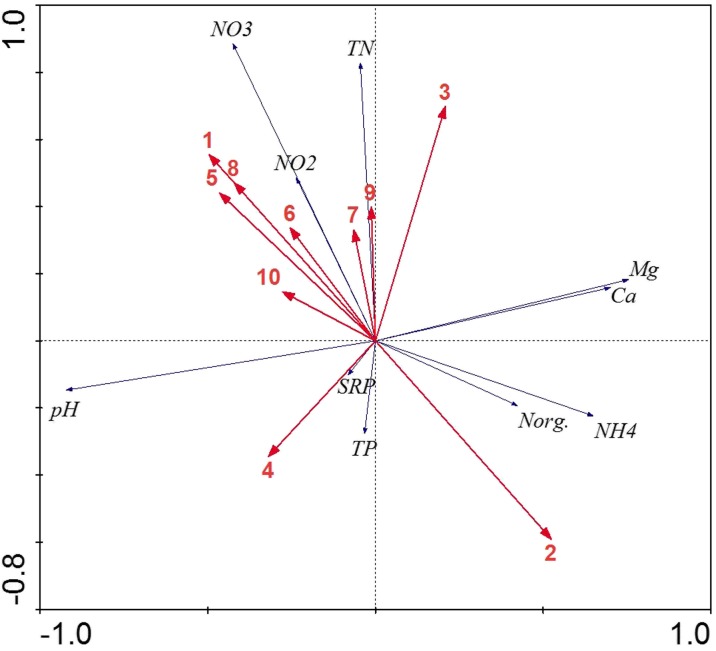
Fig. 5.
RDA ordination of the groundwater quality parameters and land use in catchments. Axis 1 explains 60.6 % of the water quality-land use relation and axis 2 explains 30.4 %. Abbreviations: SRP soluble reactive phosphate, TP total phosphorus, NO 3 nitrate, NO 2 nitrite, NH 4 ammonium, Norg. organic nitrogen, Mg magnesium, Ca calcium, 1 arable fields, 2 forest and woodlots, 3 fallow lands, 4 meadows and pastures, 5 other waters, 6 parks and gardens, 7 wetlands, 8 urban areas, 9 N supply, and 10 P supply

