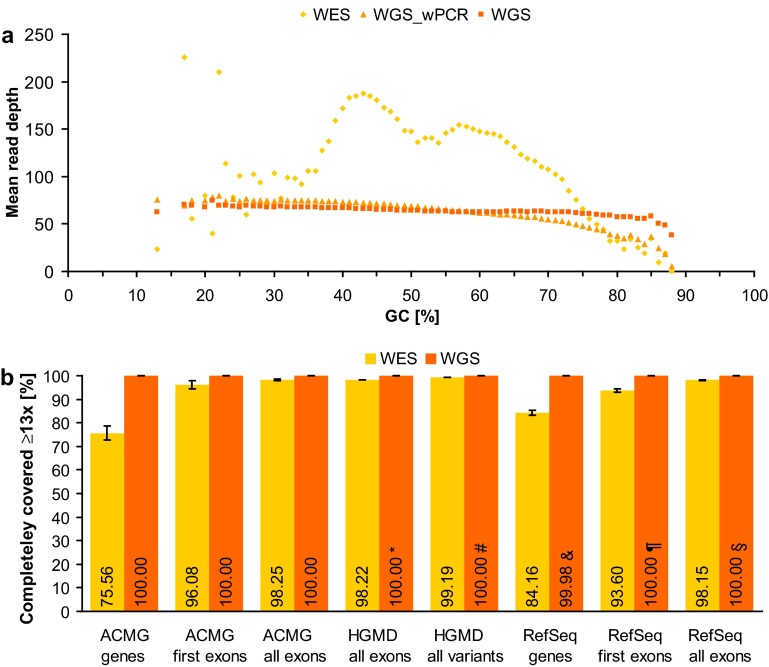
Fig. 1.
Performance comparison of WES and WGS. a Mean read depth of RefSeq coding exons per GC content shown for WES as well as for WGS with (WGS_wPCR) and without (WGS) PCR as means of five samples each. b Percentage of completely covered (i.e. ≥13 reads at each nucleotide position) genes, exons, and variants in WES and WGS without PCR as means of five samples each (error bars indicate 95 % confidence intervals). In the case of genes recommended for reporting by the ACMG (ACMG genes, n = 54) and of genes of the RefSeq database (RefSeq genes, n = 16,896), the set of all coding exons (ACMG all exons, n = 1152; RefSeq all exons, n = 177,084) and the set of start-codon-containing exons (first exons) were examined. The set of RefSeq exons harboring at least one disease-causing mutation (DM) listed in HGMD (HGMD all exons, n = 22,303) and the set of all coding and non-coding DMs (HGMD all variants, n = 106,819) were also analyzed. Note that 100.00 % implies a deviation of at most 0.005 %: *two exons were partially covered with 12 reads; #one intronic mutation was covered with 12 reads; &12 genes were partially covered with 7–12 reads; ¶three exons were partially covered with 10–12 reads; §12 exons were partially covered with 7–12 reads

