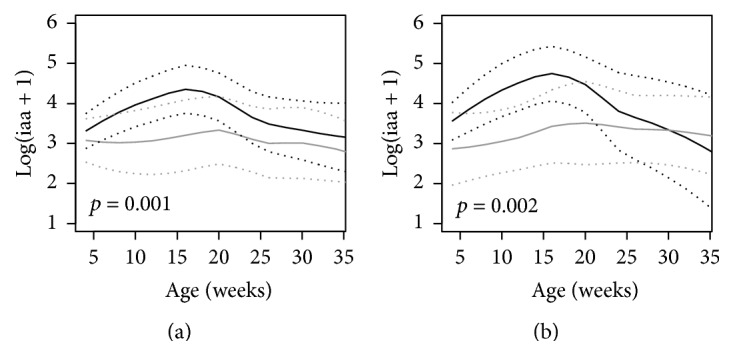
Figure 2.

Trajectories of IAA in (a) NOD mice (black line) versus NOR mice (gray line) and (b) NOD mice that developed diabetes (black line) versus NOD mice that were diabetes-free at age of 36 weeks (gray line). The unbroken lines represent 95% confidence intervals of the trajectories.
