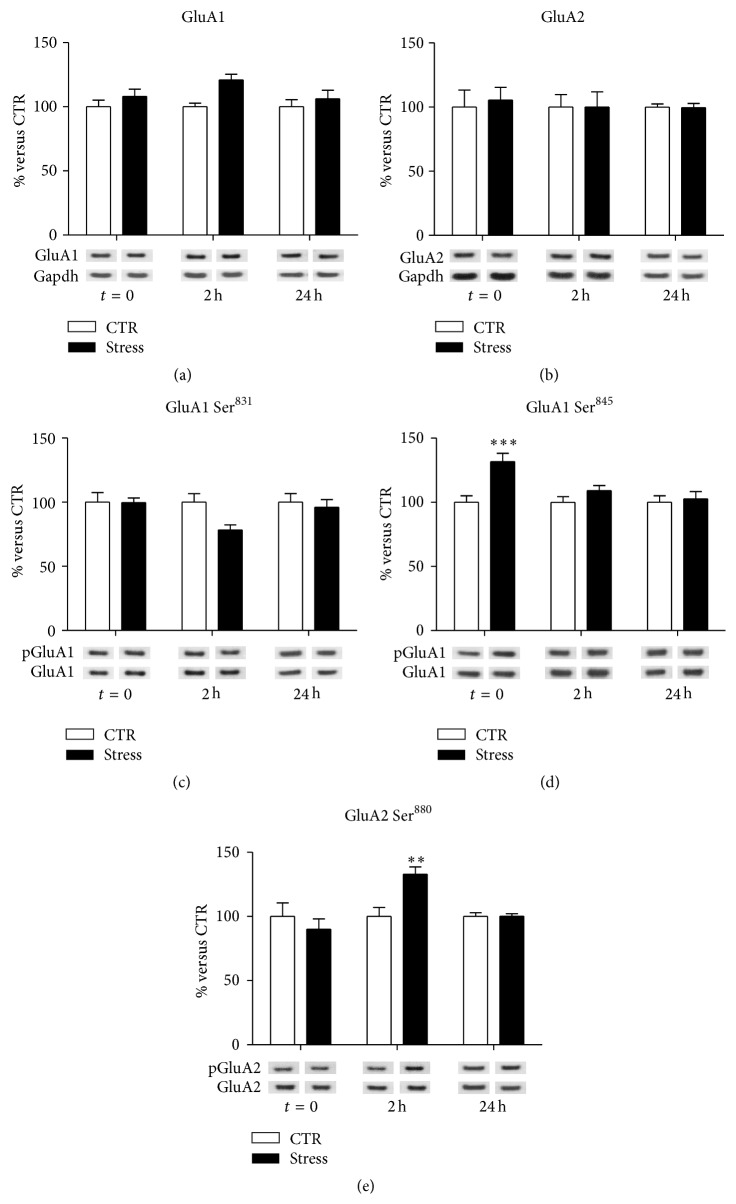
Figure 1.
Time-dependent changes of protein expression levels of GluA1 (a), GluA2 (b), GluA1 phospho-Ser831 (c), GluA1 phospho-Ser845 (d), and GluA2 phospho-Ser880 (e) in PFC/FC total homogenate of rats subjected to FS-stress and sacrificed immediately after stress and 2 h and 24 h from stress beginning. Data are represented as percentage of controls at each time point, as means ± SEM (n = 8). Statistics: Generalized Linear Models (GLM) and Bonferroni Post Hoc Test (see Section 2 for details). ∗∗ p < 0.01; ∗∗∗ p < 0.001.

