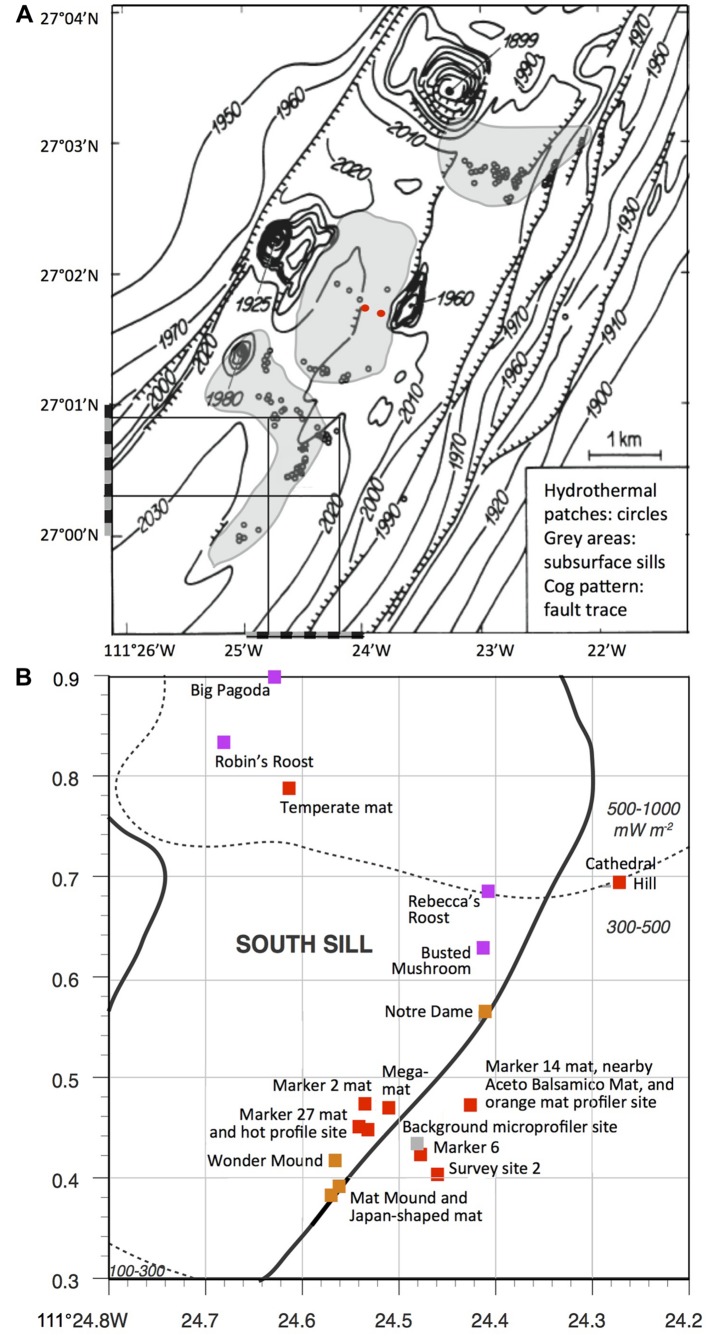
FIGURE 1.
Seafloor map of Guaymas Basin hydrothermal features. (A) The southern Guaymas trough with hydrothermal sites marked as small circles (Bazylinski et al., 1989, adapted from Simoneit and Lonsdale, 1982). The square in the southwestern corner of the chart corresponds to the seafloor area shown enlarged and in greater detail below. The positions of the two DSDP drilling holes 477 and 477A are marked by red dots. (B) Sampling area of Guaymas cruises AT15-40 and 15-56, with major hydrothermal features, superimposed on heat flow measurements of Guaymas seafloor sediments (Fisher and Becker, 1991) and subsurface sill positions indicated by gray-shaded areas (Peter and Shanks, 1992). Red squares indicate mat-dominated sites, sienna brown indicates hydrothermal mounds with diffusive venting, and purple indicates large edifices and chimneys with evidence for channelized flow. The bathymetric map is reused from Bazylinski et al. (1989) and the sill positions are redrawn from Peter and Shanks (1992) by permission of the publishers.

