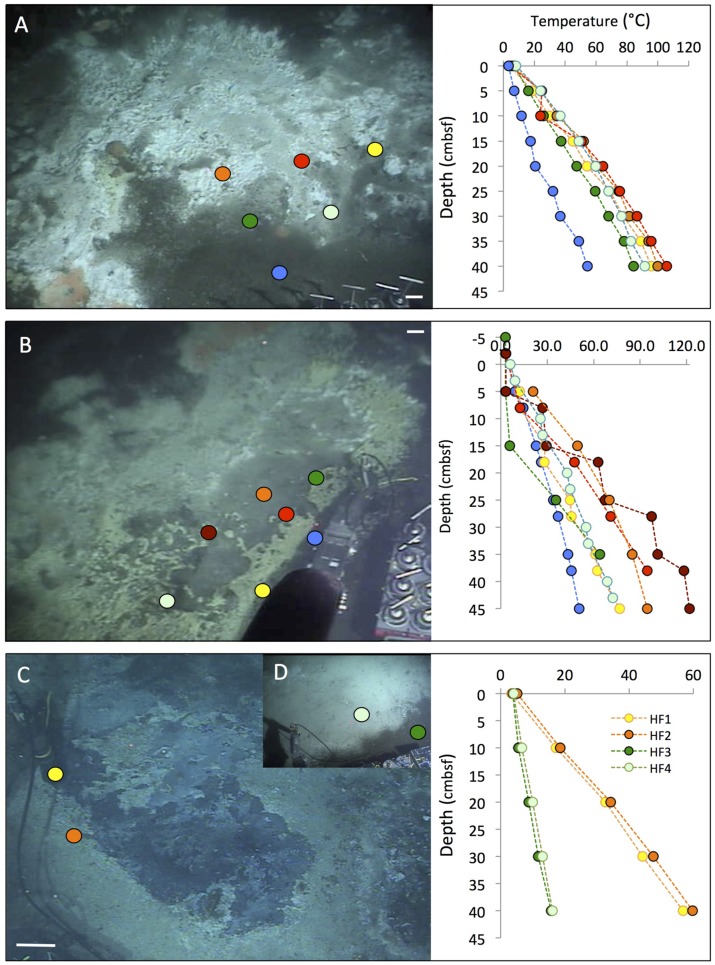
FIGURE 5.
Megamat and Cathedral Hill mats. Temperature profiles measured with the Alvin heat flow probe are marked with colored dots on the photos and plotted profiles in matching colors. The scale bar corresponds to 10 cm. (A) Partial view of hydrocarbon-rich Megamat before coring and sampling. The heat flow profiles show the thermal transition from mat-covered to bare sediment. Alvin heading 219, depth 2012 m, GMT 18:14:26, dive 4562, November 23, 2009. (B) Overview of the microbial mats area at the Cathedral Hill area, a complex of multiple white, gray, yellow, and orange mats next to a small hydrothermal massif. Alvin heading 174, depth 2020.3 m, GMT 18:33:10, dive 4565, November 26, 2009. Seven heat flow temperature gradients were measured on Alvin dive 4565 during a general survey of the area. (C) Temperate mats resembling the Cathedral Hill mats by yellow, white and gray surface colors. Alvin heading 126, depth 2021 m, GMT 18:37:07, dive 4574, December 5, 2009. (D) The small insert in the upper right corner shows a nearby, significantly cooler, white–gray and smooth mat area. Alvin heading 120, depth 2020.7 m, GMT 19:17:40, dive 4574, December 5, 2009. Photographs courtesy of the Woods Hole Oceanographic Institution, from RV Atlantis cruise AT 15-56.

