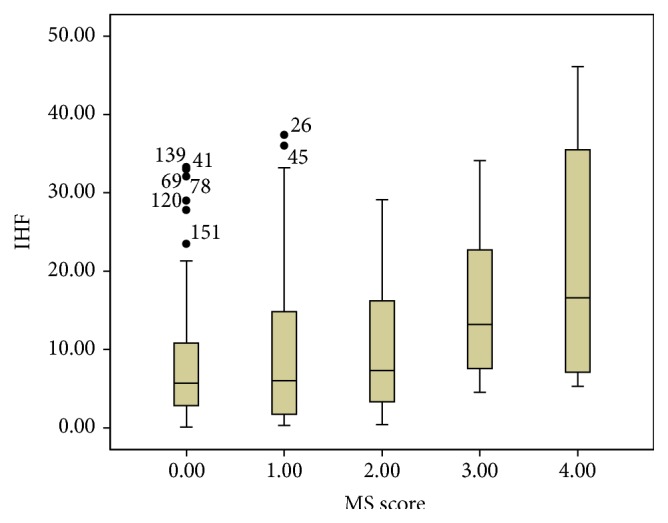
Figure 4.

Boxplots of IHF with respect to MS score. The lower boundary of the box and whisker plot corresponds to the 25th percentile, the line within the box corresponds to the median, and the upper boundary of the box corresponds to the 75th percentile. The whiskers extend to the most extreme data point, which is no more than 1.5 times the interquartile range from the box.
