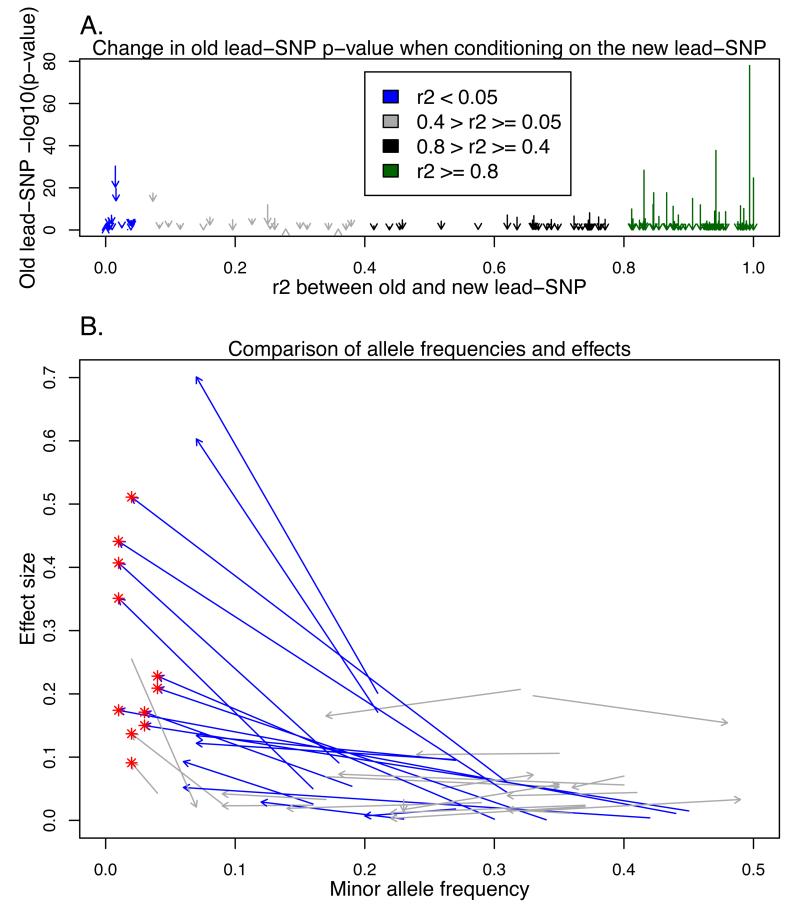
Figures 1A-B.
Change in p-value after analysis conditional on the new lead-SNP and comparison of new and previously reported lead-SNP effect sizes and allele frequencies per locus. In both figures, each of the arrows represent one locus and trait, where significant association was found in our screening and in one of the previously published large-scale screening studies2,3 and the colouring is based on the linkage disequilibrium (LD) between the old and new lead-SNP. The red ‘*’ represents for the new low-frequency lead-SNPs. In the Figure 1A, on the Y-axis are the −log10 p-values, arrows starting from the p-value seen in the unconditional analysis in Finnish subset (N = 12,834) and pointing to the p-value in analysis conditional on the new lead-SNP. In Figure 1B, each arrow starts from established lead-SNP effect and minor allele frequency (MAF) and points to the corresponding values for the new lead-SNP. The effects have been estimated in the FRCoreExome9702 sample set (N = 5,119), independent of the discovery set. Only results for loci with r2<0.4 have been presented for clarity.

