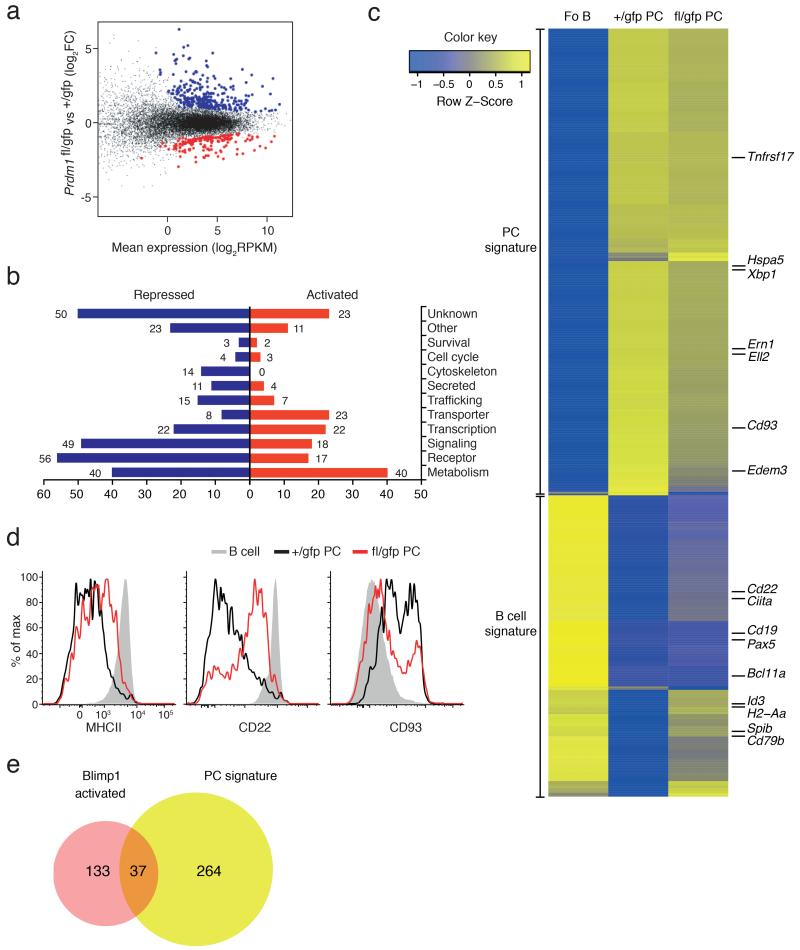
Figure 2.
Transcriptional analysis of Blimp-1-deficient plasma cells. (a–c) Whole genome RNA-sequencing analysis on BM PCs, sorted from Prdm1+/gfpCreERT2 (+/gfp) or Prdm1fl/gfpCreERT2 (fl/gfp) mice 21 days after tamoxifen treatment. (a) Scatter plot of differential expression. Genes with significantly increased (Blimp-1-repressed, blue) or decreased (Blimp-1-activated, red) expression in the absence of Blimp-1 (fl/gfp) are indicated (FDR <0.05, normalized average expression ≥4 RPKM in at least one sample). (b) Functional classification and quantification of proteins encoded by repressed (blue) and activated (red) Blimp-1 targets in PCs. (c) Heat map shows the expression of the published gene signatures for follicular B cells (Fo B)6 and BM PCs6 from +/gfp and fl/gfp mice. The positions of some genes of interest are highlighted. (d) Flow cytometry profiles of BM mature B cells (B220hiCD19hi) and PCs (CD138+Blimp-1-GFP+) showing Blimp-1–regulated surface molecules after 21 days after tamoxifen treatment. Data is representative of at least 3 experiments. (e) Venn diagram showing overlap and differences between Blimp-1 activated target genes (Supplementary Table 1) and the PC gene signature6. Data in a–c, e derive from 2 experiments.

