Figure 3.
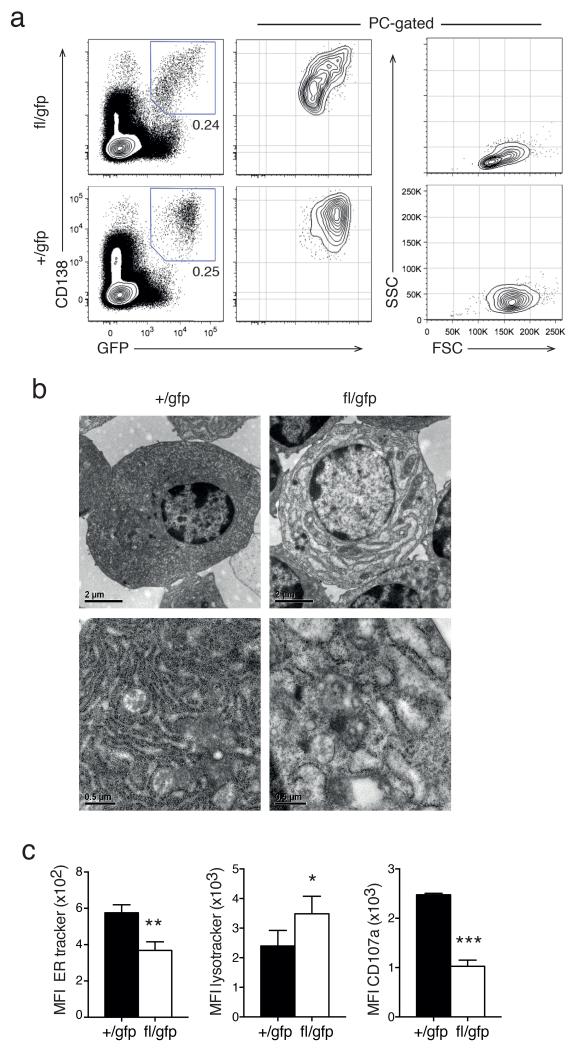
Blimp-1 controls plasma cell size and morphology. (a) Cytometry profiles of Prdm1+/gfpCreERT2 (+/gfp) and Prdm1fl/gfpCreERT2 (fl/gfp) BM cells (left) and gated CD138+Blimp-1-GFP+ PCs (middle and right) 35 days after tamoxifen treatment. Data is representative of 5 experiments. (b) Electron micrograph of isolated +/gfp and fl/gfp BM PCs 21 days after tamoxifen treatment. Data is representative of 2 experiments. (c) Mean fluorescent index (MFI) of organelle specific dyes (left, ER mitotracker and middle, lysotracker) and of surface CD107a expression (right) of +/gfp and fl/gfp BM cells 35 days after tamoxifen treatment. Data is the mean ± S.D. from 3 experiments. P values compare the indicated groups using a paired t-test. * P <0.05, ** P <0.01, *** P <0.005.

