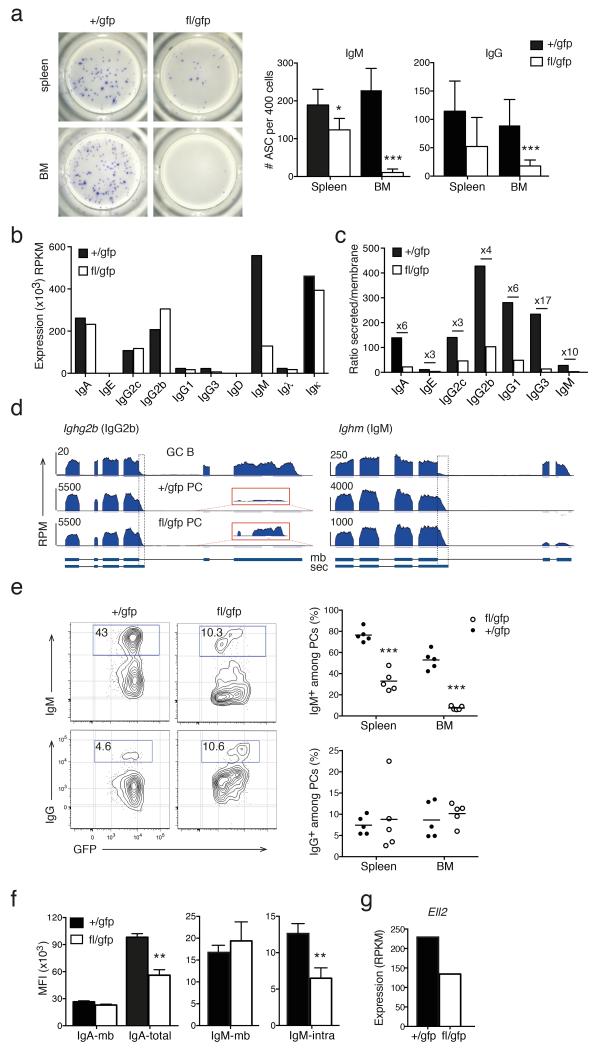
Figure 4.
Blimp-1 controls immunoglobulin production. (a) ELISPOT assay for IgM and pan-IgG secretion from isolated +/gfp and fl/gfp PCs 14 days after tamoxifen treatment. Left, images of representative wells of an anti-IgM assay. Right, graphs depict mean ± S.D. from a representative of 2 experiments. (b-d) RNA sequencing analysis of Igh transcripts in +/gfp and fl/gfp BM PCs analyzed as described in Fig. 2. (b) Normalized expression in RPKM of Igh and Igl constant regions. (c) Ratio of secreted (sec) / membrane-bound (mb) mRNA for each Igh isotype. Numbers specify the fold change between +/gfp and fl/gfp cells. (d) RNA sequencing tracks of Ighg2b and Ighm in Prdm1+/gfp GC B cells, +/gfp and fl/gfp BM PCs. Boxes with dotted lines delineates the secretion specific sequences. Red boxes show the increased usage of the membrane specific exons of Ighg2b (magnified 85×). (e) Cytometry profiles of +/gfp and fl/gfp BM PCs 28 days after tamoxifen treatment showing intracellular staining of IgM and IgG (left). Right, graphs depict the percentage of IgM+ or IgG+ cells among the Blimp-1-GFP+ PC population in spleen and BM. Symbols show individual mice, horizontal line is the mean. (f) Left, mean fluorescence index (MFI) of plasma membrane (mb) or total (mb and intracellular) expression of IgA, detected by sequential staining with the same Ab, in +/gfp and fl/gfp BM PCs 35 days after tamoxifen treatment. Right, MFI of plasma membrane (mb) or specific intracellular (intra) expression of IgM, detected by separate anti-IgM Abs, in +/gfp and fl/gfp BM PCs 35 days after tamoxifen treatment. Graphs depict mean ± S.D. from ≥2 experiments. (g) RNA sequencing analysis of the expression of Ell2 in +/gfp and fl/gfp BM PCs as described in Fig. 2. P values compare the indicated groups using a paired t-test. * P <0.05, ** P <0.01, *** P <0.005.

