Figure 5.
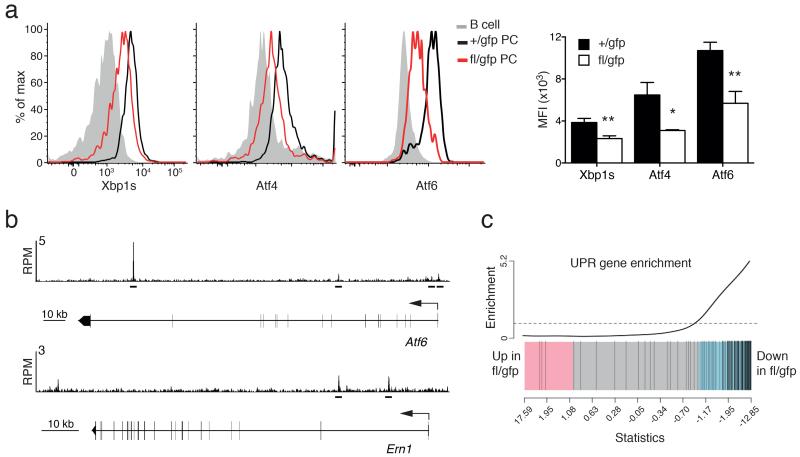
Blimp-1 controls the unfolded protein response (UPR). (a) Cytometry profiles of intracellular staining of the expression of the key transcription factors of the UPR pathway: XBP-1s, Atf4 and Atf6, in Prdm1+/gfpCreERT2 (+/gfp) and Prdm1fl/gfpCreERT2 (fl/gfp) BM PCs 35 days after tamoxifen treatment. Graph shows the mean fluorescent index (MFI) of expression in PCs from ≥2 experiments. P values compare the indicated groups using a paired t-test. * P < 0.05, ** P < 0.01. (b) Blimp-1 binding at the Atf6 and Ern1 (encodes for Ire1) genes in LPS stimulated Prdm1Bio/BioRosa26BirA/BirA tagged PBs. Blimp-1 peaks are shown together with the exon-intron structure of the gene and a scale bar in kilobases (kb). RPM, reads per million reads. Bars below the tracks indicate Blimp-1-binding regions identified by MACS peak calling. (c) Gene set enrichment analysis barcode plot comparing differential gene expression in fl/gfp and +/gfp BM PCs after tamoxifen treatment, as in Fig. 2. The differential gene expression dataset is shown as a shaded rectangle with genes horizontally ranked by moderated t statistic. Genes upregulated upon Blimp-1 loss shaded pink (t > 1) and downregulated genes shaded blue (t < −1). The 119 UPR genes, identified by gene annotation and filtered for expression in PCs, are marked on the plot by vertical black lines and enriched for genes downregulated without Blimp-1 (P =0.001).

