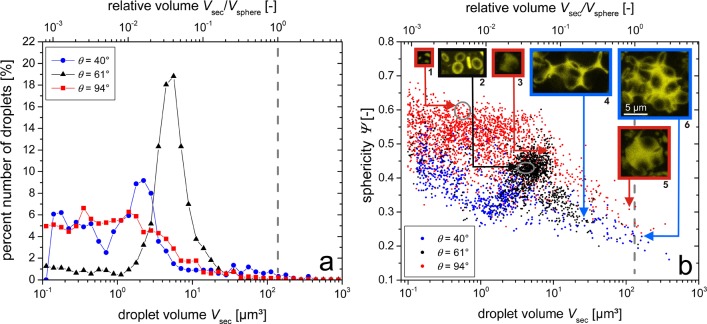
Figure 4.
Droplet number percent distribution (a) and Wadell sphericity Ψ (b) of the individual second fluid droplets with 40° (blue), 61° (black), and 94° (red). Both parameters are shown as a function of the droplet volume (bottom axis of abscissae) and as a function of the droplet to particle volume ratio Vsec/Vsphere (upper axis of abscissae). The dashed gray lines denote the mean volume of a single solid particle. The insets (1–6) in (b) show projections of example droplets from the 3D confocal images with volumes and sphericities as marked. Gray circles denote the regions containing all of the separate droplets of insets 1 and 2. The scale bar in inset 6 is valid for all of the droplet images.

