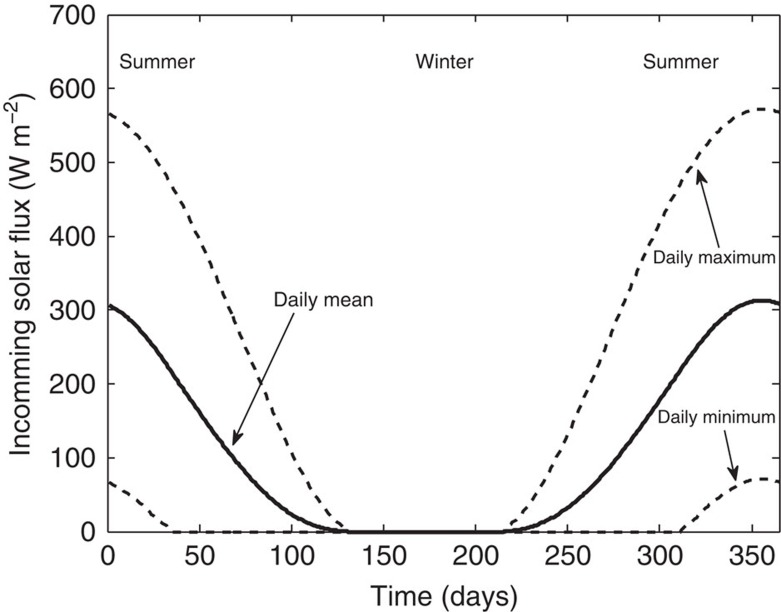
Figure 4. Ice surface solar energy.
The computed incoming shortwave energy flux S(t) reaching the Frontier Mountain meteorite trap ice surface, showing the daily mean (solid line), maximum daily value (upper dashed line) and minimum daily value (lower dashed line). These were calculated using the libRadtran atmospheric radiative-transfer model31 (as detailed in the Methods section).

