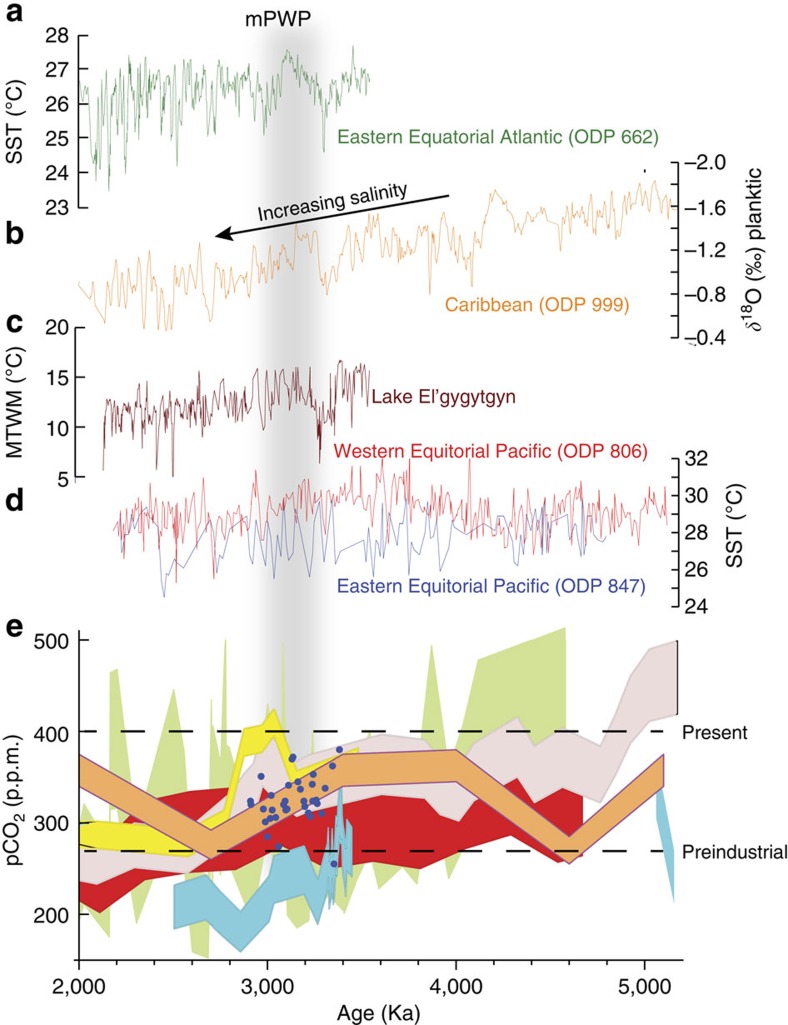
Figure 2. Sample time series analyses.
Time series illustrating commonly used palaeoenvironmental proxies. Vertical grey band represents position of mPWP. (a) Equatorial Atlantic SST based on alkenone unsaturation index44. (b) Caribbean Sea oxygen isotope record111 showing increasing salinity due to shoaling of the Central American Seaway. (c) Terrestrial record of the mean warmest month temperature from Lake El'gygytgyn56. (d) Equatorial Pacific SST records based on Mg/Ca palaeothermometry51. (e) Estimates of Pliocene atmospheric CO2 with pre-industrial and present day levels (horizontal dashed lines) for comparison; dark blue dots, δ13C (ref. 3); green band, δ11B (ref. 7); pink band, alkenone5; red band, alkenone6; orange band, stomata4; yellow band, δ11B (ref. 5); blue band, Ba/Ca59; Modified from ref. 50.

