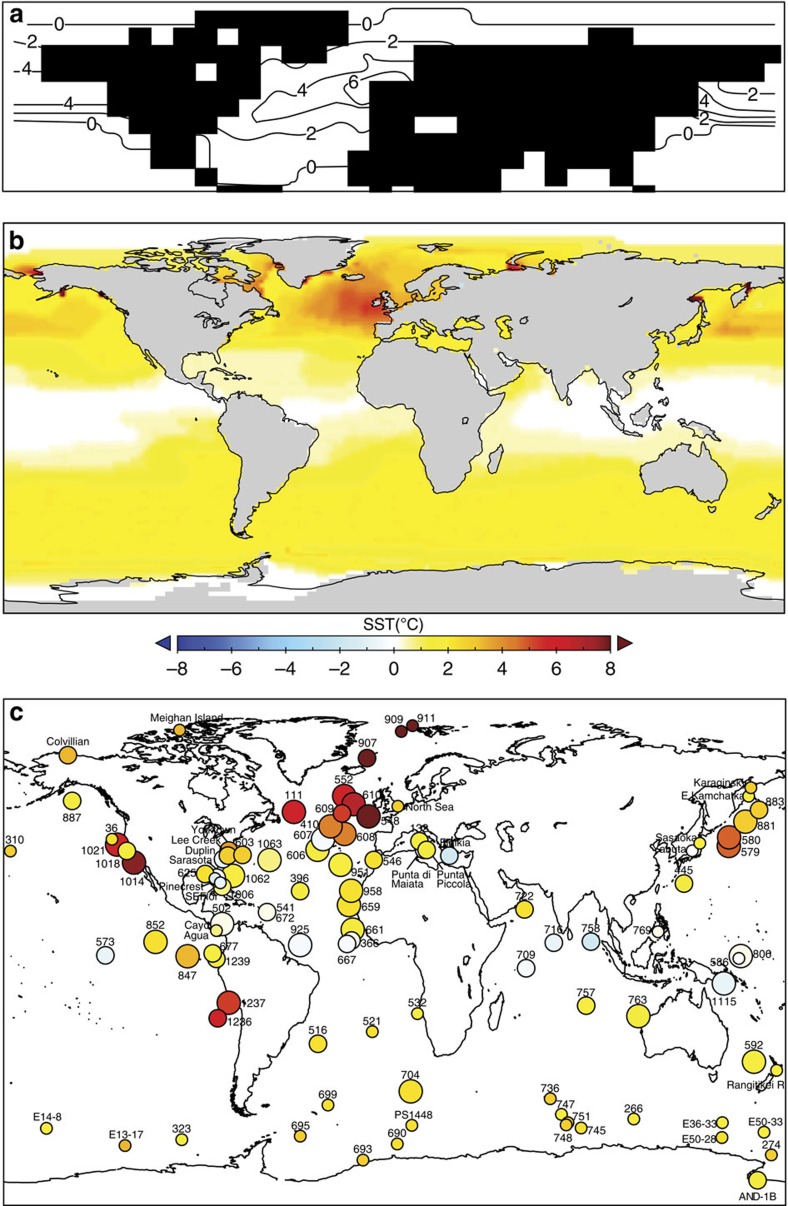
Figure 3. Evolution of the PRISM reconstruction.
The PRISM mean annual SST anomalies. (a) PRISM0 Northern Hemisphere reconstruction112. (b) PRISM2 global reconstruction20,21. (c) PRISM3 confidence-assessed global reconstruction where larger diameter circles represent higher confidence levels; numbers designate sample localities9,17,57. SST anomaly colour scale the same for b,c.

