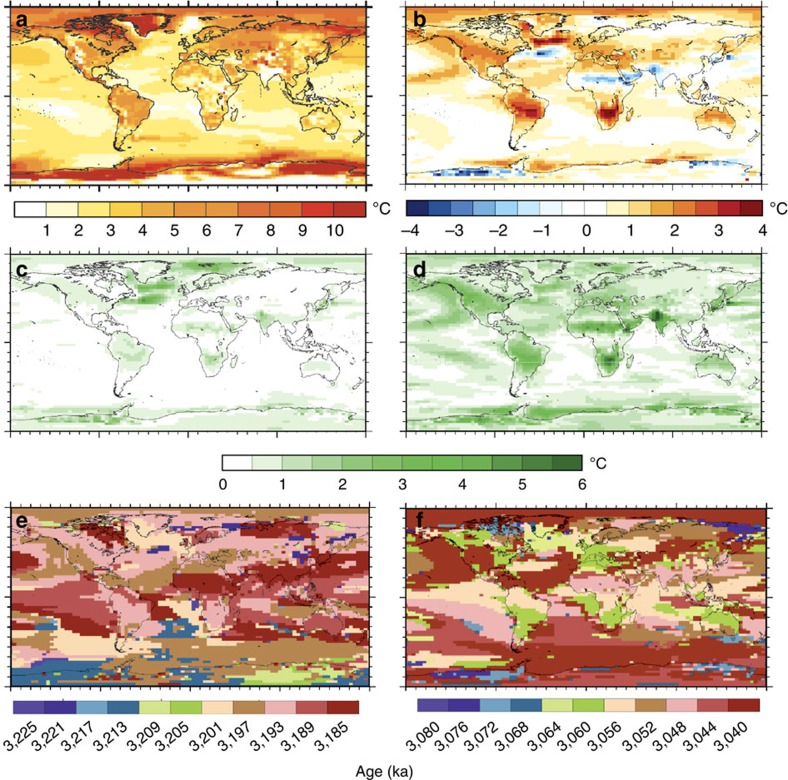
Figure 6. Simulating Pliocene climate variability.
Hadley Coupled Climate Model Version 3 (HadCM3) simulations of surface air temperature (SAT °C) variability during the Pliocene redrawn and modified from ref. 107. (a) Annual mean Pliocene SAT (°C) prediction for interglacial Marine Isotope Stage (MIS) KM5c minus a pre-industrial experiment. (b) Annual mean SAT for Interglacial MIS K1 minus KM5c. Note that MIS K1 shows warmer SATs in most regions of the world compared to KM5c. (c) Variability in SATs 20 Kyrs ± of the benthic oxygen isotope peak of the KM5c interglacial. (d) Same as c but showing SAT variability ±20 Kyrs around the benthic oxygen isotope peak of the K1 interglacial. Note the larger degree of SAT variability in d compared to c. (e) Timing of the maximum SAT warming relative to the pre-industrial in each model grid box for KM5c ± 20 Kyrs. (f) Same as e but for K1 ±20 Kyrs. e and f Maximum SAT warming relative to the pre-industrial is not globally synchronous and varies in nature between MIS KM5c and K1. Modified from ref. 107.

