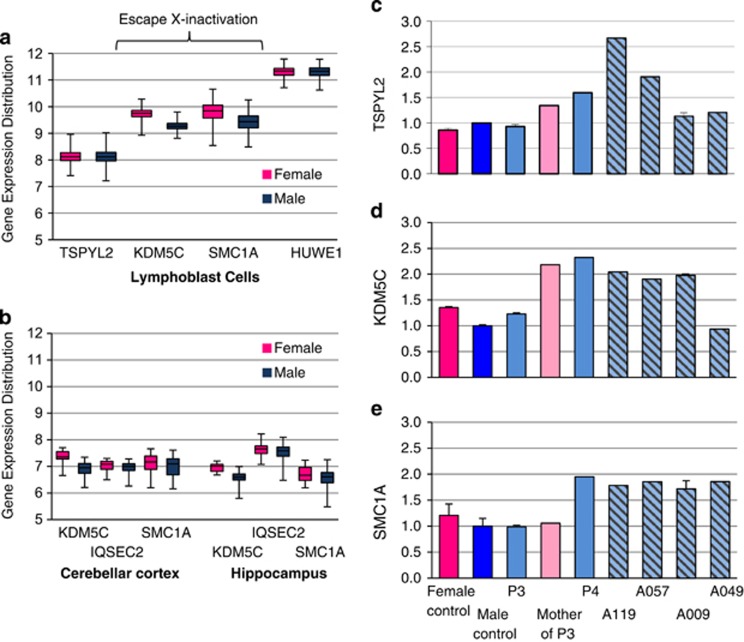
Figure 3.
Expression distribution of XLID genes involved in submicroscopic duplications of Xp11.2. Distribution of XLID gene expression in each gender: Data from NCBI GEO database of Affymetrix Human Exon array ST 1.0 expression was analyzed using GEO2R. Distribution of normal expression in males (blue box plot) and females (pink box plot) is shown for TSPYL2, KDM5C, SMCIA and HUWE1 in LCLs (a), and KDM5C, IQSEC2 and SMC1A in two regions of the brain–Cerebellar cortex (left panel) and Hippocampus (right panel) (b). Data sets included GEO series GSE49531 ‘Gene expression data from LCLs from participants in genetics of microangiopathic brain injury' (females, n=515 and males, n=368). Series GSE46706 ‘Expression data generated from post-mortem human brain tissue originating from neurologically and neuropathologically control individuals' (females, n=23 and males, n=73). All data sets can be found at NCBI GEO gene expression omnibus site, searching with the specific GEO series number. Changes to expression of TSPYL2 (c) and XLID genes KDM5C (d) and SMC1A (e): cDNA was prepared from total RNA extracted from LCL male (n=4) and female (n=5) pooled controls and patients 3 and 4, and the mother of patient 3. Transcript levels measured by qRT-PCR were normalized to housekeeping gene HPRT and shown as relative difference to male pool set at 1.0. Error bars indicate standard error of the mean from replicate cDNA samples. Female control is shown in bright pink, male control in dark blue, male patients in pale blue, mother of patient in pale pink and patients reported in Froyen et al20 in pale blue background with diagonal lines.

