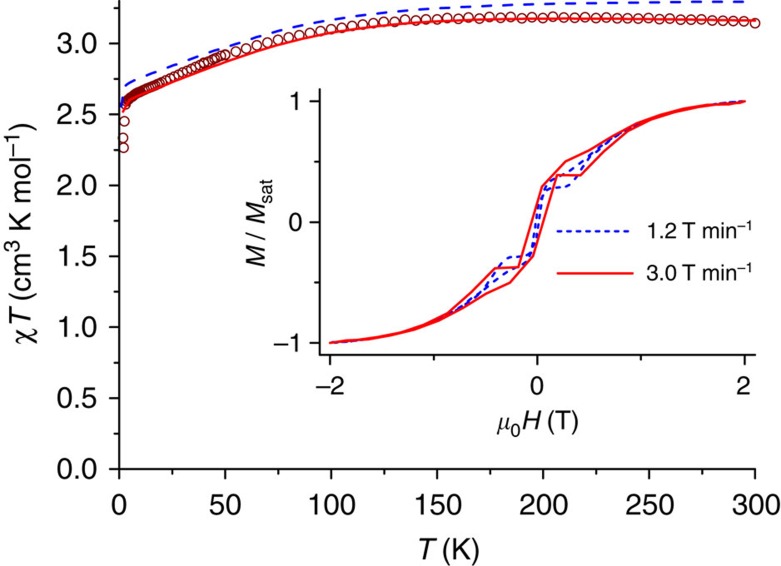
Figure 2. DC susceptibility.
Susceptibility temperature product χT as a function of temperature recorded on a powder sample of 1 at an applied field of 1,000 Oe (T<50K) and 10,000 Oe (T>40 K). The solid red line is a spin-Hamiltonian fit with D=–115 cm−1, g⊥=2.20, g||=3.03. The dashed blue line is a simulation on the basis of the correlated calculations. The inset shows the magnetic hysteresis curve at T=1.8 K for 1 in fluorolube at two different scan rates as indicated.

