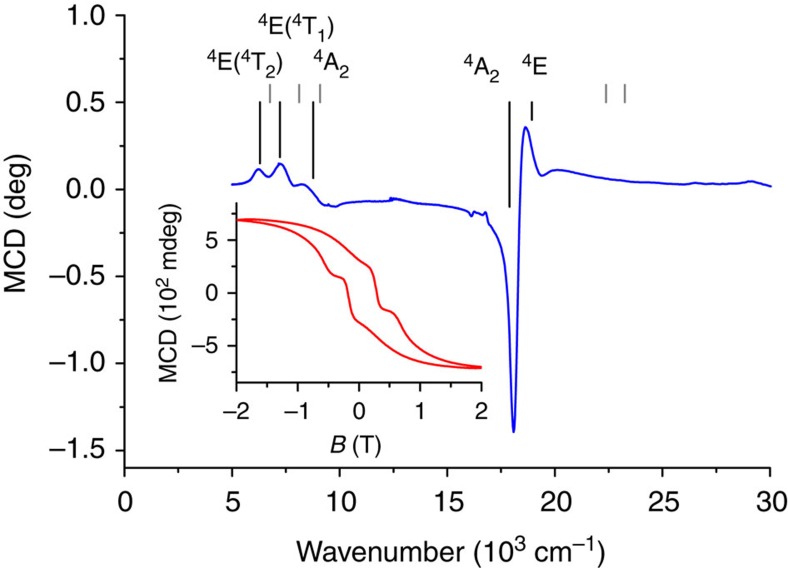
Figure 5. Magnetic circular dichroism spectroscopy.
MCD spectra recorded on a mull of 1 in fluorolube at T=1.5 K and B=2 T. Grey lines are the calculated transition energies from CASSCF calculations, black lines are the transition energies from ligand field analysis of the MCD results. The inset shows the magnetic hysteresis recorded by measuring the MCD intensity at 18,100 cm−1 ( that is at maximum of the third 4B1→4E transition band) as a function of the magnetic field B, with a scan rate of 0.5 T min−1 revealing a coercive field of 0.24 T.

