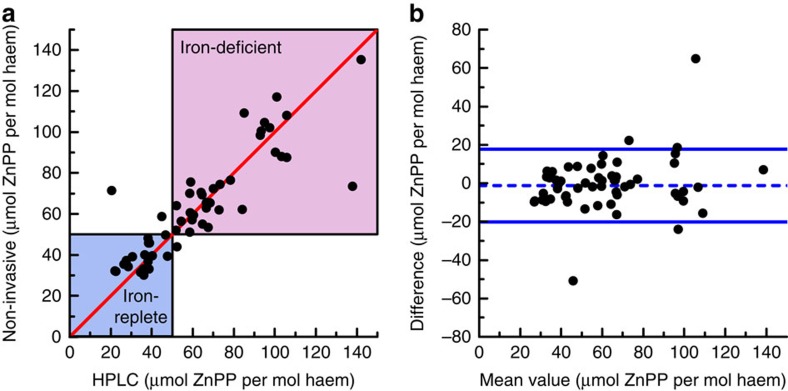
Figure 4. Comparison of the non-invasive measurements with the reference HPLC method in the clinical study of 56 women after childbirth.
(a) Comparison of the scaled non-invasive measurements in vivo with reference HPLC measurements in vitro. The blue area indicates values for subjects who are iron-replete (red blood cell ZnPP<40 μmol per mol haem) or in an indeterminate zone (red blood cell ZnPP 40–50 μmol per mol haem, in which elevations do not necessarily indicate iron deficiency but may result from recent infection, inflammation or other factors). The red-shaded area indicates those who are functionally iron-deficient (red blood cell ZnPP>50 μmol per mol haem). The line of identity is shown by the diagonal line in red. (b) Bland–Altman plot of the data presented in a. The blue lines indicate the robust limits of agreement (equalling 1.96 times the robust s.d.). The bias is indicated by the dashed blue line. Details for the two outliers are provided in the Supplementary Note 2.

