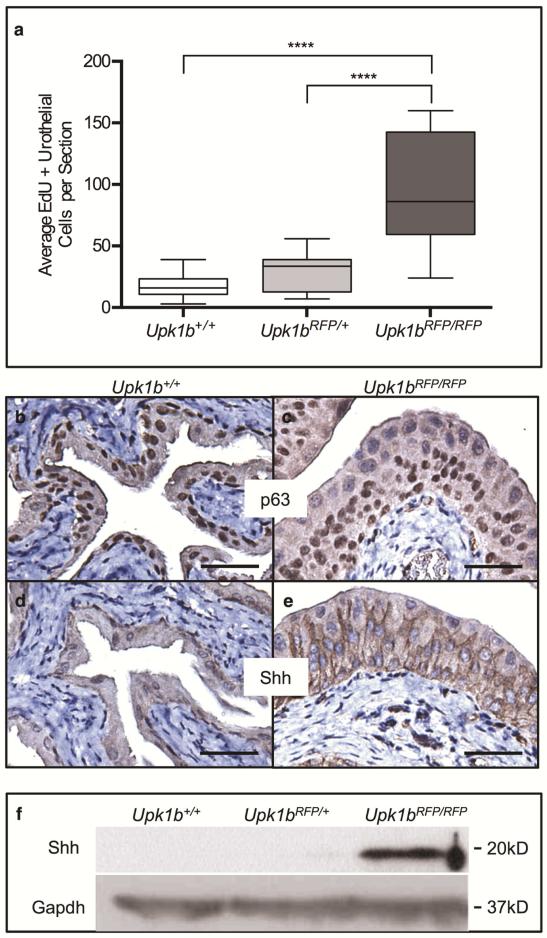
Figure 4. Absent Upk1b and Urothelial Plaque Increase Urothelial Proliferation.
(A) A box and whiskers plot displays the average EdU+ urothelial cells (UCs) per section in Upk1b+/+, Upk1bRFP/+ and Upk1bRFP/RFP bladders (n=3). Whiskers represent the minimum and maximum. A two-way ANOVA in conjunction with Tukey's multiple comparison correction was used to calculate p-values. ****p < 0.0001. (B-E) Expression of p63 and the downstream target Shh were evaluated in Upk1b+/+ and Upk1bRFP/RFP bladder urothelium by immunohistochemistry. (F) Protein expression in Upk1b+/+, Upk1bRFP/+ and Upk1bRFP/RFP bladders was evaluated by immunoblotting for Shh and Gapdh. Scale bars indicate 25μm (B-E).

