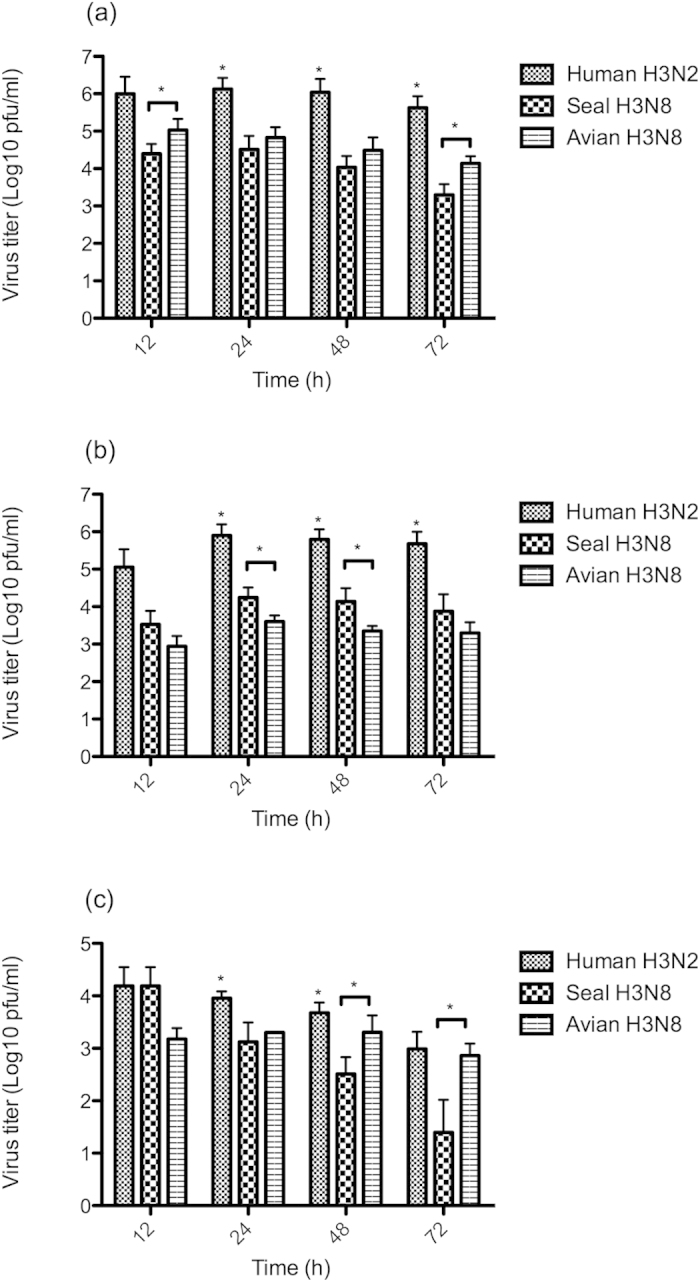
Figure 5.

Replication kinetics of human H3N2, seal H3N8 and avian H3N8 viruses in MDCK (a), A549 (b) and DEF (c) cells. Cell monolayers seeded in 12-well plates were infected in duplicate, then allowed to adsorb for 60 minutes, then the virus inoculum were aspirated and cells were washed with PBS. Viral supernatants were collected at 12, 24, 48 and 72 hours post-infection and titrated by plaque assay in MDCK cells. Error bars represent the 95% confidence intervals (CI) of the mean of two independent experiments. Human H3N2 virus titers that were significantly higher than both of its seal and avian H3N8 counterparts are denoted by an asterisk (*). Statistically significant differences between the seal and avian H3N8 viruses are denoted by a horizontal line and an asterisk at the specified time points.
