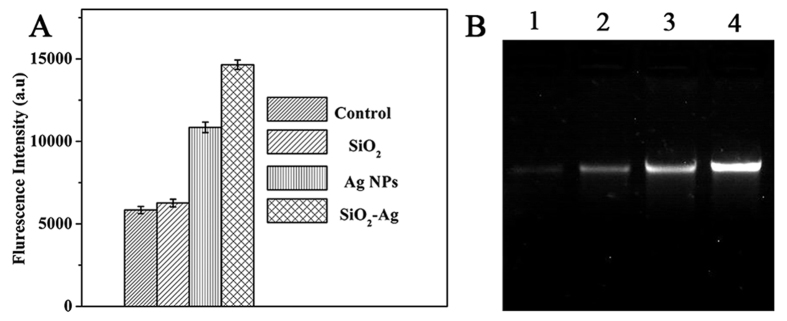
Figure 8.
(A) Formation of ROS in Xoo cells after a 2 h incubation period with the control, SiO2 nanospheres, Ag NPs and the SiO2-Ag composites. ROS were detected by fluorescence measurement of the reporter DCF. Each data point represents the mean value from at least three independent experiments. (B) Electrophoresis analysis of genomic DNA in Xoo cells treated with different concentrations of the SiO2-Ag composites for 4 h. Lanes 1, 2, 3 and 4 represent genomic DNA extracted from Xoo cells treated with 12.5, 3.2, 0.8 and 0 μg/mL of the SiO2-Ag composites, respectively.

