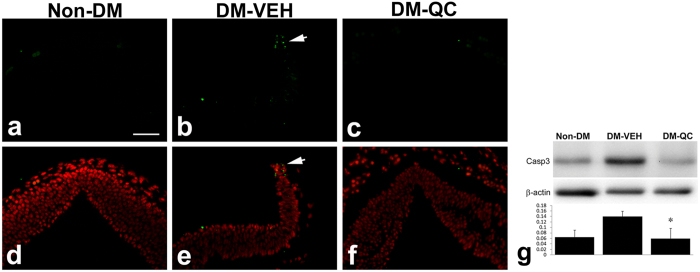
Figure 2. Apoptosis in the neural tissue of the embryos of diabetic pregnancies.
(a–c) TUNEL assay of E10.5 embryos in the posterior midbrain. Positive signals are green. (d–f) Merged images of TUNEL and DAPI (red) staining. (a,d) Non-DM. (b,e) DM-VEH. Arrow indicates TUNEL positive cells in the dorsal region of the neural tube. (c,f) DM-QC. Scale bar = 50 μm in all images. (g) Western blot assay of cleaved caspase-3. Upper pane: Western blots; lower panel: quantification of blot band density (mean ± SD); *p < 0.05 (DM-VEH vs. Non-DM; DM-VEH vs. DM-QC; n = 4).

