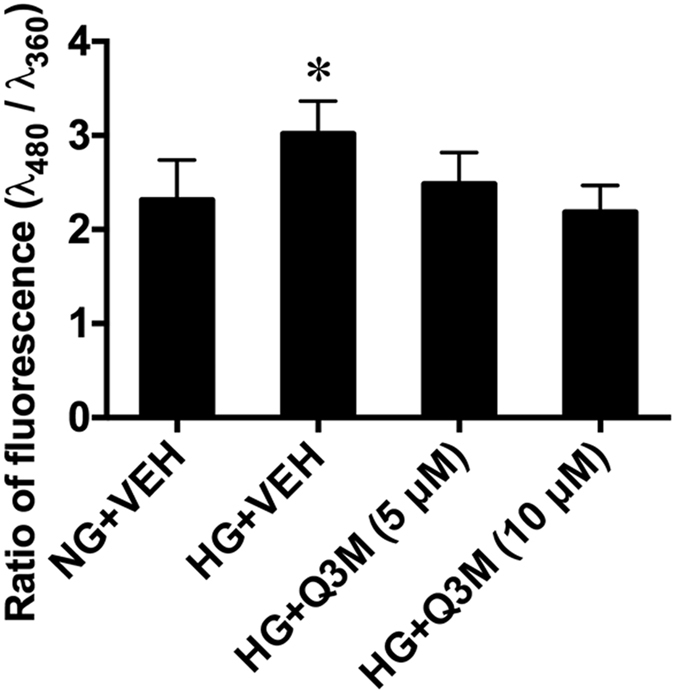
Figure 4. Effect of Q3M on ROS production in neural stem cells in high glucose.

Quantification of fluorescence of an ROS dye (H2DCFDA) in neural stem cells (NE-4C) treated with Q3M in high glucose for 24 hours. *p < 0.05, comparison between HG +VEH and each of the other groups; n = 6 (repeated three times).
