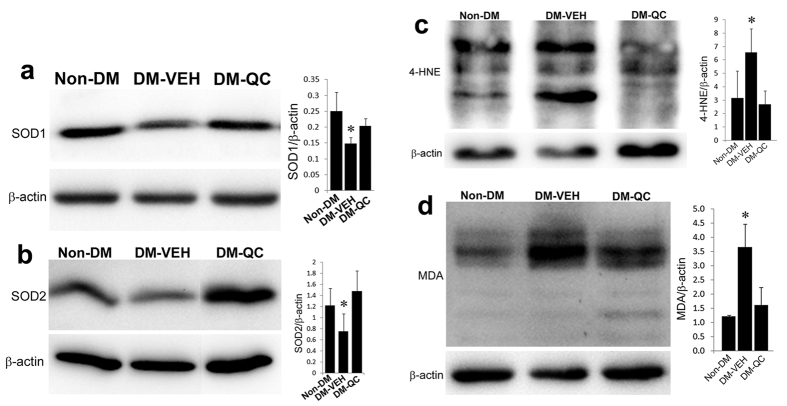
Figure 6. Alleviation of Oxidative stress by quercetin.
Western blot assessments of protein expression in the neural tissues of E10.5 embryos. (a) Sod1. (Left panel) Western blots; (Right panel) Quantification of blot band density (Mean ± SD). (b) Sod2. (Left panel) Western blots; (Right panel) Quantification of blot band density (Mean ± SD). (c) 4-HNE. (Left panel) Western blots; (Right panel) Quantification of blot band density (Mean ± SD). (d) MDA. (Left panel) Western blots; (Right panel) Quantification of blot band density (Mean ± SD). β-actin, loading control. *p < 0.05 [(DM-VEH vs. Non-DM; DM-VEH vs. DM-QC; n = 4 (a,b); n = 3 (c,d)].

