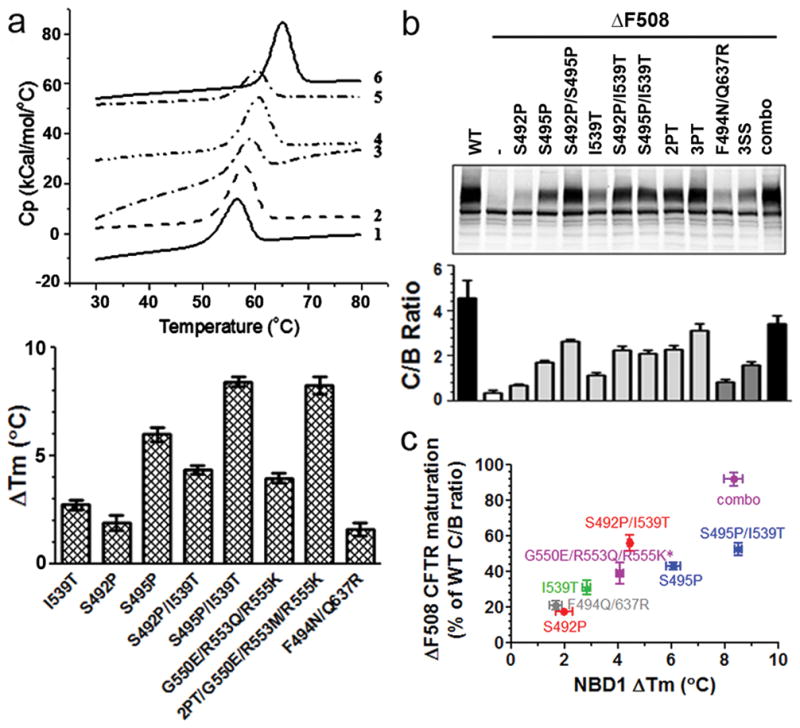
Figure 2. Correlation between NBD1 thermal stability and ΔF508 CFTR maturation.

(a). Upper panel: DSC heat capacity profiles for WT-(ΔRI, ΔRE)-NBD1 and sequence-matched NBD1 stabilizing mutants in buffer containing 2 mM ATP and 3 mM MgCl2 at a scan rate of 2 °C/min. 1-WT; 2-S492P; 3-I539T; 4. S492P/I539T; 5-G550E/R553Q/R555K; 6-combo. Lower panel: The Tm difference between ΔRI/ΔRE-NBD1 with those carrying various NBD1 stabilizing mutations. The values represent the mean ± SD (N=2–3) (b). HEK cells transiently transfected with WT and ΔF508 CFTR with various NBD1 stabilizing mutants were grown at 37°C for 48 hr. The intensity of mature C band and immature B band was quantified and the C/B ratio was calculated. The values represent the mean ± SD (N=3–6). 2PT: S492P/A534P/I539T; 3PT: 2PT+S495P. (c). The rescue of ΔF508 CFTR by NBD1 stabilizing mutants were expressed as the percent of WT C/B ratio and plotted against the Tm increase caused by corresponding mutants in ΔRI/ΔRE-NBD1. * In full length CFTR R553M was introduced instead of R553Q in isolated NBD1. Based on our single mutation analysis, the Tm difference between G550E/R553Q/R555K and G550E/R553M/R555K is less than 1°C.
