
Figure 1.
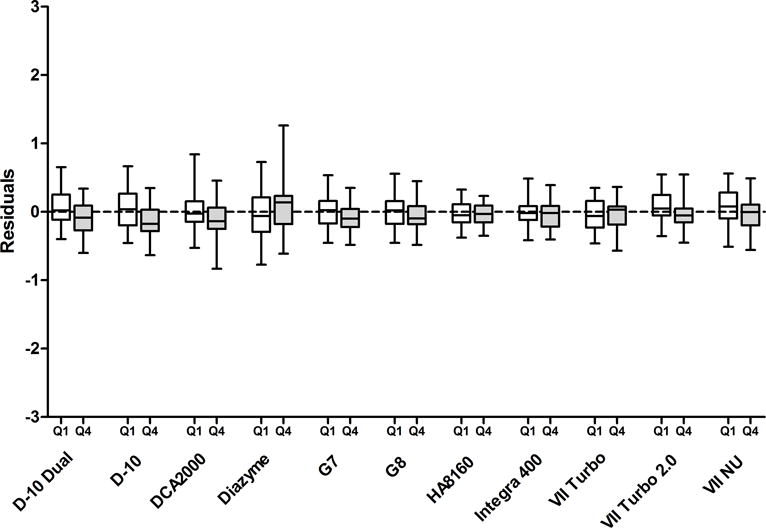
Box plots of the residuals of the regression of HbA1c compared to the comparative method for the lowest and highest (shaded) eGFR quartiles. The horizontal line within each box is the median of the residuals. The upper and lower limits of each box correspond to the 25th and 75th percentile of the residuals. The highest and lowest whiskers represent the minimal and maximal residuals. Q1, lowest eGFR quartile; Q4, highest eGFR quartile.