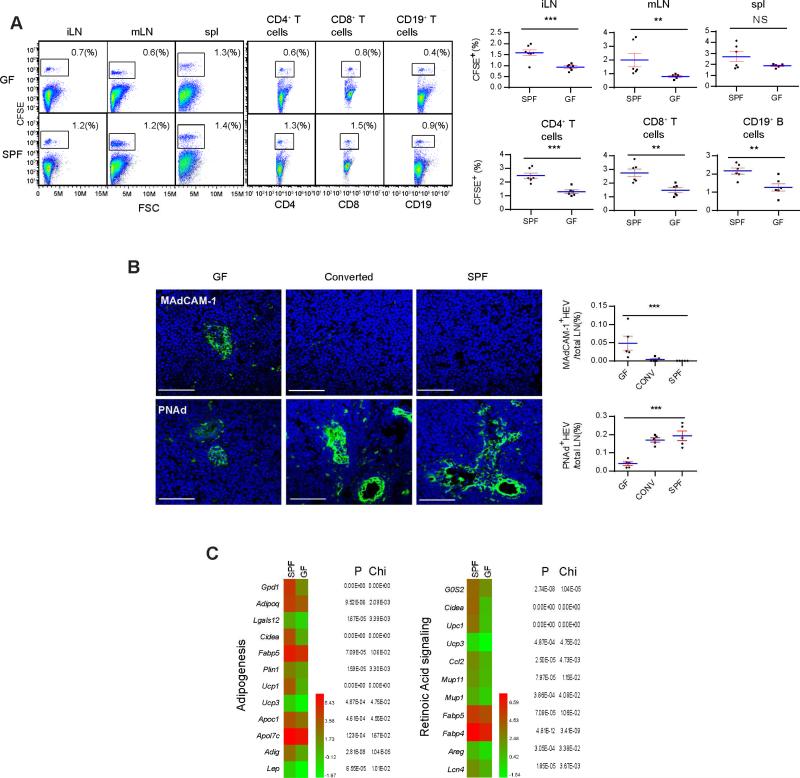
Figure 1. Homing of lymphocytes to peripheral lymph nodes is defective in germ-free mice.
(A) 107 CFSE-labeled total SPF pLN lymphocytes were isolated from C57BL/6 SPF mice and i.v. injected into GF or SPF recipients. 24 hrs later, the arrival of these cells in iLN, mLN and the spleen, and CD4+, CD8+ and CD19+ subpopulations in iLN were analyzed by flow cytometry. The right panels show results from multiple mice. Student's t analysis results for this and all subsequent figures are indicated as follows: p<0.001: ***; p<0.01: **; p<0.05: *; p at 0.05 or larger was considered non-significant: N.S.. The data are representative of four independent experiments. (B) iLN of GF, SPF-cohoused GF (1 week) and SPF iLN were stained with DAPI (blue) and either MECA-367 (anti-MAdCAM-1) or MECA-79 (anti-PNAd) (green) antibody, and analyzed by confocal imaging. The scale bars in this and all subsequent figures are 50 μm. See Figure S1A for lumen area size and number analyses. Shown is a representative slide from a total of at least 30 sections, and sections were collected throughout entire lymph nodes. Images were processed with Image J and surface areas were calculated by the ruler-transformed pixels. (C) Total mRNA from pooled pLN (excluding mLN) was extracted from 5 week-old C57BL/6 GF and SPF mice and analyzed as detailed in the methods. mRNA ratios between GF and SPF reaching statistical significance were displayed by function groups. P and X2 values from RNAseq assay are shown to the right. Shown are the heat maps for gene functions associated with adipogenesis and RA signaling, corresponding data shown as bar graphs are in Figure S1D. See Figure S1B and S1C for the total heat map and other gene function groups. The data are representative of two independent experiments. Also see Figure S1.

