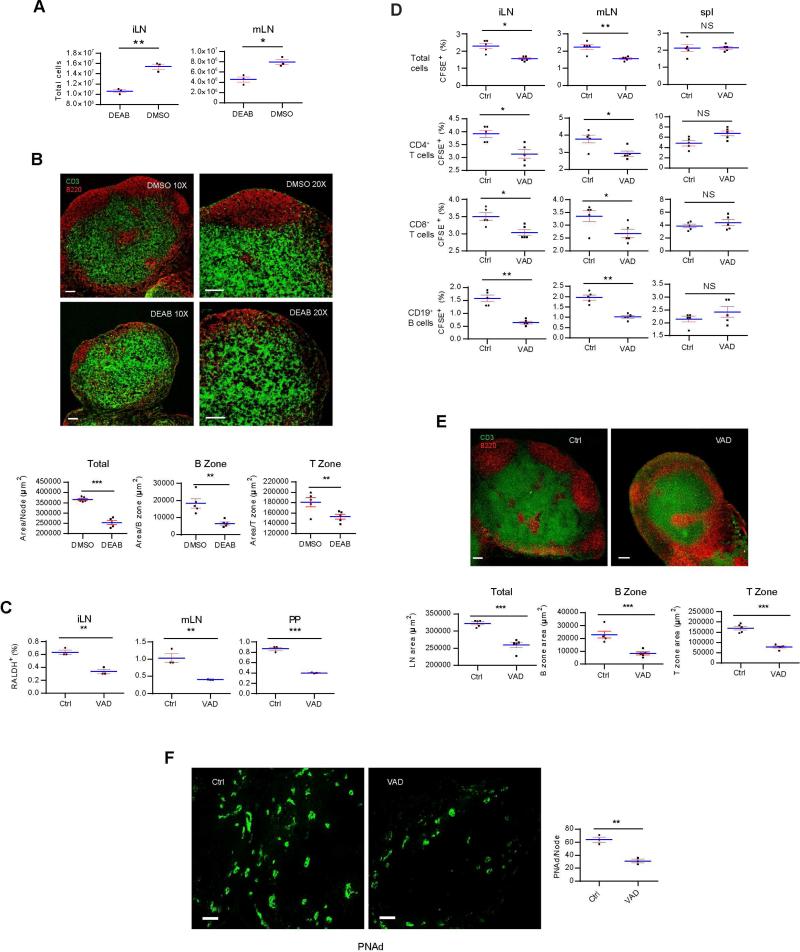
Figure 7. Vitamin A deficiency causes a reduced homing of neo-mi DCs into pLN and the lack of maintenance of pLN structures.
(A) Single-cell suspensions of iLN and mLN from DEAB-treated 5 week-old SPF mice were counted for total cell numbers. (B) The same LN in A was stained for anti-CD3 and anti-B220. Overall surface area of LN and accumulative T zone defined by dense anti-CD3 stain in one LN are shown in lower panels. For B cell area, single B cell zone defined by dense anti-B220 stain was counted. (C) iLN, mLN, and PP from 2 week-old VAD and control-fed mice were analyzed by flow cytometry for the presence of neo-mi DCs. (D) CFSE-labeled 107 total lymphocytes were i.v. injected into VAD and control-fed mice, and the presence of these cells and their CD4+, CD8+ and CD19+ subsets in iLN, mLN and the spleen was analyzed by flow cytometry after 24 hrs. (E) Similar to B, iLN of VAD and control-mice were stained with anti-CD3 and anti-B220 and analyzed by confocal imaging. Area analysis as in B is shown in the lower panels. (F) iLN of VAD and control-fed mice were stained for PNAd expression. Scale bar: 100 μm. Right panel is the cell counts per LN. All data are representative of at least three independent experiments. Also see Figure S6.

