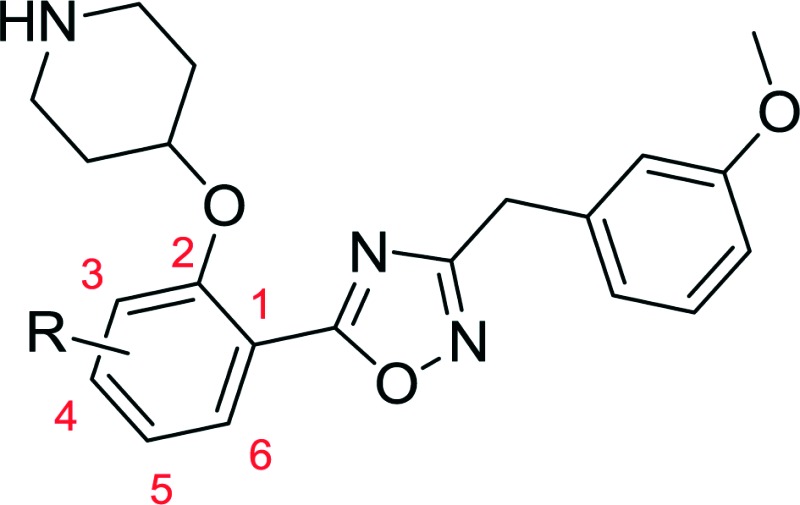
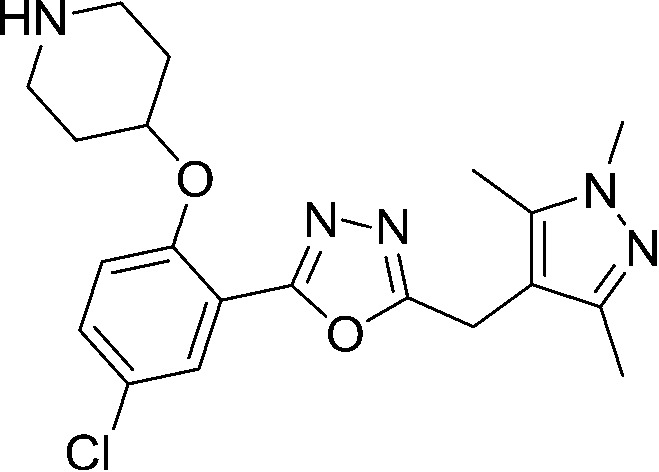
Table 2. Enzyme affinity and cellular potency for inhibitors based on a phenyl scaffold.

| |||||||
| No. | R | clog P a | LdNMT |
HsNMT K i (μM) | Ld EC50 c (μM) | Macrophage LD50 d (μM) | |
| K i (μM) | LE b | ||||||
| 10a e | H | 3.4 | 0.06 | 0.37 | 1.24 | >30 | — |
| 10b | 3-OMe | 3.2 | 4.02 | 0.26 | 7.23 | — | — |
| 10c | 3-Me | 3.9 | 1.43 | 0.29 | 7.44 | — | — |
| 10d | 4-Me | 3.9 | 5.18 | 0.26 | 4.64 | — | — |
| 10e e | 4-OMe | 3.2 | 3.04 | 0.26 | 0.86 | — | — |
| 10f e | 4-Cl | 4.0 | 0.36 | 0.32 | 0.45 | — | — |
| 10g e | 4-F | 3.5 | 0.03 | 0.37 | 0.59 | 10.2 | 29.5 |
| 10h | 4-Br | 4.2 | 0.68 | 0.30 | 0.26 | — | — |
| 10i | 5-Me | 3.9 | 0.24 | 0.32 | 0.76 | — | — |
| 10j | 5-Cl | 4.0 | 0.02 | 0.38 | 0.07 | 6.7 | 18.0 |
| 10k | 5-OMe | 3.2 | 0.05 | 0.35 | 0.76 | 13.5 | 27.9 |
| No. | Structure | clog P | LdNMT |
HsNMT K i (μM) | Ld EC50 (μM) | Macrophage LD50 (μM) | |
| K i (μM) | LE | ||||||
| 13 |

|
1.8 | 0.01 | 0.39 | 0.02 | >50 | >90 |
