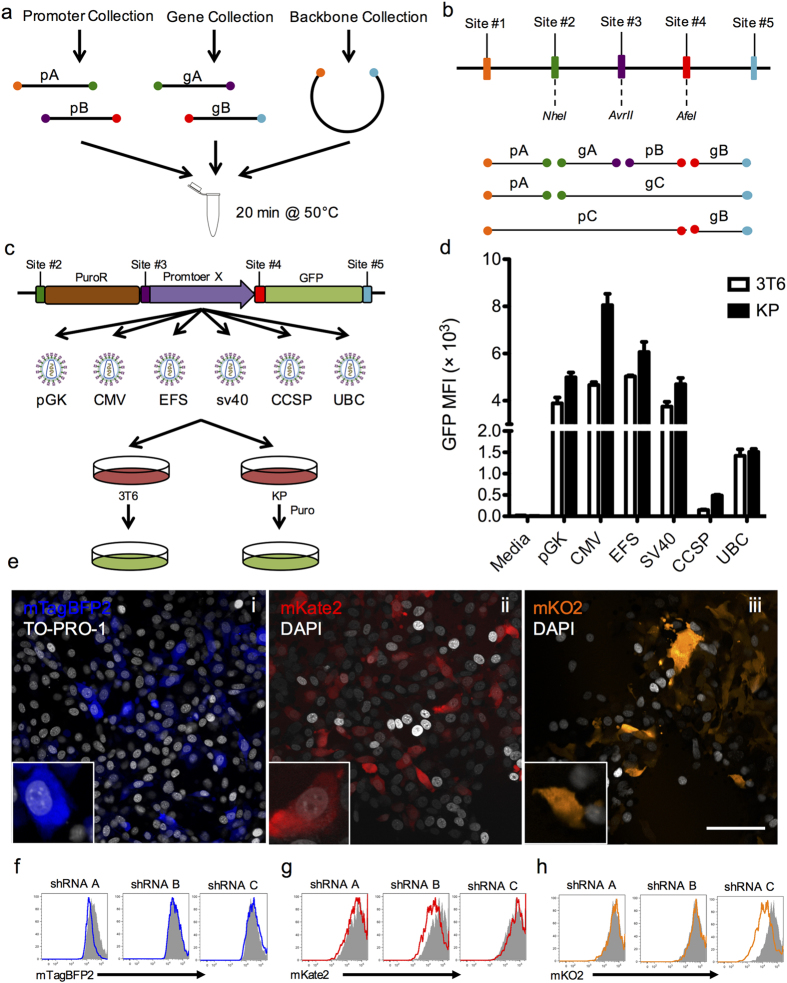
Figure 1. Gibson assembly-based modular assembly platform (GMAP).
(A) Promoters, genes, and backbones from established GMAP-compatible collections are used in a one step isothermal assembly reaction to produce DNA constructs on demand. (B) Schematic of possible orderings of genes and promoters. Promoter A (pA) is flanked by sites 1 and 2, promoter B (pB) is flanked by sites 3 and 4, promoter C (pC) is flanked by sites 1 and 3, gene A (gA) is flanked by sites 2 and 3, gene B (gB) is flanked by sites 4 and 5, and gene C (gC) is flanked by sites 2 and 5. (C) Schematic diagram of experiment using GMAP retroviral backbone. Retroviruses expressing GFP driven by different promoters were assembled using GMAP and used to transduce murine 3T6 fibroblasts or murine lung cancer (KP) cells. PuroR, puromycin resistance; pGK, human phosphoglycerate kinase 1 promoter; CMV, cytomegalovirus immediate-early promoter; EFS, elongation factor 1α promoter; SV40, simian virus early 40 promoter; CCSP, clara cell secretory protein promoter; UBC, human Ubiquitin C promoter. (D) Bar graph shows flow cytometry measurements of median fluorescence intensity (MFI) of GFP from 3T6 and KP cells transduced with GMAP-generated retrovirus. Data are representative of at least three independent experiments. (E) GMAP-generated lentiviruses expressing mTagBFP2-AUTR (i), mKate2-BUTR (ii), or mKO2-CUTR(iii) sensor cassettes were assembled and used to transduce a Cre reporter cell line (3TB). 3TB cells were selected with hygromycin and visualized by confocal microscopy. Insets show higher magnification. Scale bar, 100 μm. (F-H) Histograms from 3TB cells expressing mTagBFP2-AUTR (F), mKate2-BUTR (G), or mKO2-CUTR (H) transfected with three inducible hairpin constructs targeting the A, B, or C 3’UTRs assembled using GMAP. After transfection 3TB cells were selected with blasticidin, treated with doxycycline, and knockdown was assessed by flow cytometry analysis on GFP+ cells. Grey histograms represent cells lines transfected with an inducible shRNA targeting luciferase. Data are representative of at least three independent experiments.

