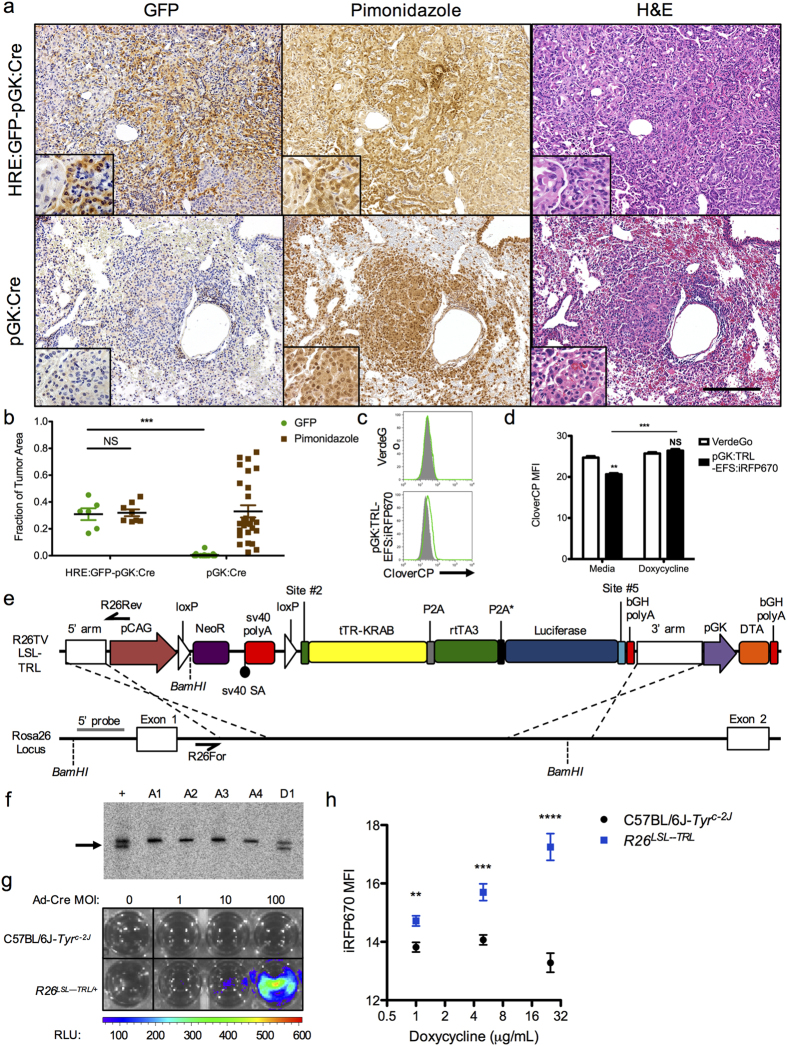
Figure 2. In vivo applications of GMAP using lentiviral and Rosa26 targeting constructs.
(A) K-rasLSL−G12D/+;p53fl/fl mice were infected with GMAP-generated hypoxia response element (HRE):GFP-pGK:Cre or pGK:Cre lentivirus. After 30 weeks tumors were assessed for GFP expression, hypoxia as determined by pimonidazole staining, and hematoxylin and eosin (H&E). Insets show higher magnification. Data are representative of at least three independent experiments. Scale bar, 200 μm. (B) Column scatter plot shows quantification of immunohistochemistry shown in (A). Data are presented as fraction of tumor area that expressed GFP or pimonidazole staining. NS, p > 0.05; ***p = 5.82 × 10⁻¹². (C) FACS histogram of KP cells engineered to express CloverCP in the presence of doxycycline and rtTA (VerdeGo) that were transduced with a GMAP-generated pGK:tTR-KRAB-rtTA3-Luc (TRL)-EFS:iRFP670 lentivirus and treated with media (grey histogram) or doxycycline (green line). Data are representative of at least three independent replicates. (D) Bar graph shows quantification of flow cytometry shown in (C). NS, p > 0.05; **p = 7.68 × 10⁻⁴; ***p = 2.46 × 10⁻⁴. (E) Map of a GMAP-generated Rosa26 targeting vector (R26TV) and scheme for knock-in of a Cre-dependent tTR-KRAB-rtTA3-Luc construct into the Rosa26 locus. LSL, loxP-Stop-loxP; NeoR, neomycin resistance; bGH polyA, bovine growth hormone polyadenylation signal; DTA, diphtheria toxin fragment A. Relevant primer binding sites (black half arrow) for PCR screening and restriction sites and probe (grey line) for Southern analysis are shown. (F) Southern analysis of ES cell DNA. C57BL/6J-Tyrc-2J ES cells were electroporated with AsiSI-linearized R26TV and subclone genomic DNA was digested with BamHI and probed, yielding a 5.8 kb product for the wild type Rosa26 locus and a 4.8 kb product for the targeted Rosa26 allele. A1-D1, clone number; +, positive control; arrow, targeted product. (G) Bioluminescence imaging of C57BL/6J-Tyrc-2J or R26LSL-TRL (clone D1) ES cells transduced with increasing multiplicity of infection (MOI) CMV-Cre adenovirus (Ad-Cre). Data are representative of at least three independent replicates. (H) Plot shows flow cytometry measurement of iRFP670 expression in C57BL/6J-Tyrc-2J or R26LSL-TRL ES cells transduced with a GMAP-generated tetracycline response element promoter (pTRE):iRFP670-EFS:Cre-2A-GFP lentivirus and treated with doxycycline. Data are representative of at least three independent replicates. **p = 3.71 × 10⁻³; ***p = 6.51 × 10⁻⁴; ****p = 3.60 × 10⁻⁵.

