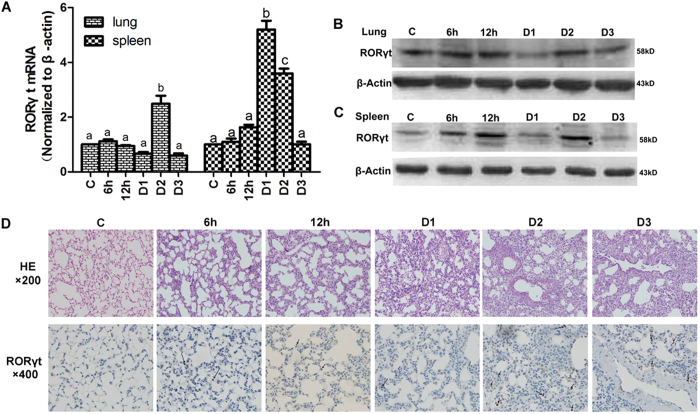
Figure 3. Th17 cells are highly expressed at D2 during ALI development.
(A) The expression of RORγt mRNA in lung and spleen tissue at different time points. The error bars indicate SEM. The different superscript letters (a–c) represent a significant difference of these columns (p < 0.05). (B,C) Western blot analysis tested the expression of RORγt protein in the lungs and spleen, respectively. (D) Histopathological and immunohistochemistry findings (HE: ×200; IHC: ×400). The tan color indicates RORγt-positive staining. Arrows indicate positive cells. All mice were wild type, with 4~6 mice per group.

