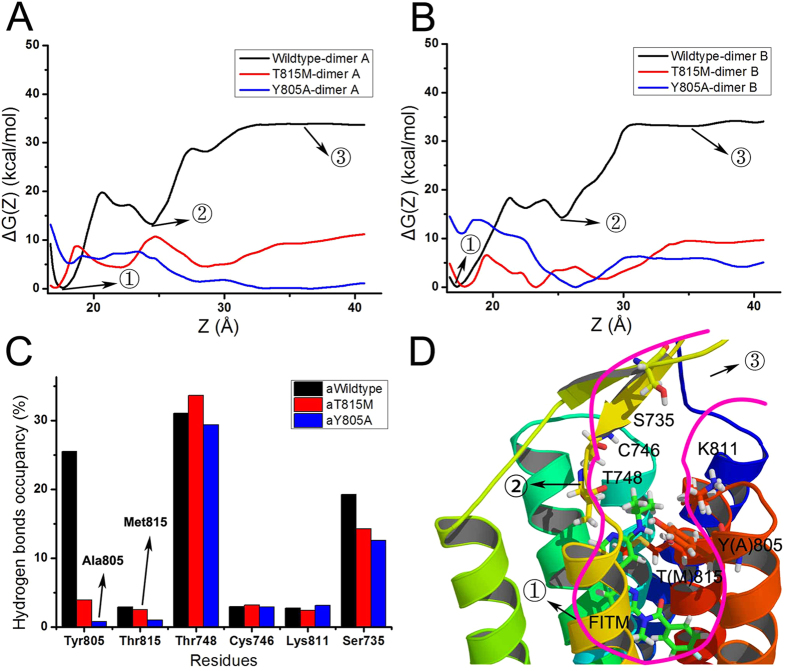
Figure 7. Free energy calculations.
(A,B) The free energy calculations are profiled when FITM separates from dimer A, B of wild type, T815M and Y805A mGlu1 system, respectively. (C) The average hydrogen bonds occupancy on dimer A and B of mGlu1 along the separated route of FITM. (D) The cartoon diagram of the separated path of FITM and key interactive residues of overlapped structures of wild type, T815M and Y805A mutants of mGlu1. The T(M)815 represents residue T815 or M815. And Y(A)805 represents residue Y805 or A805.

