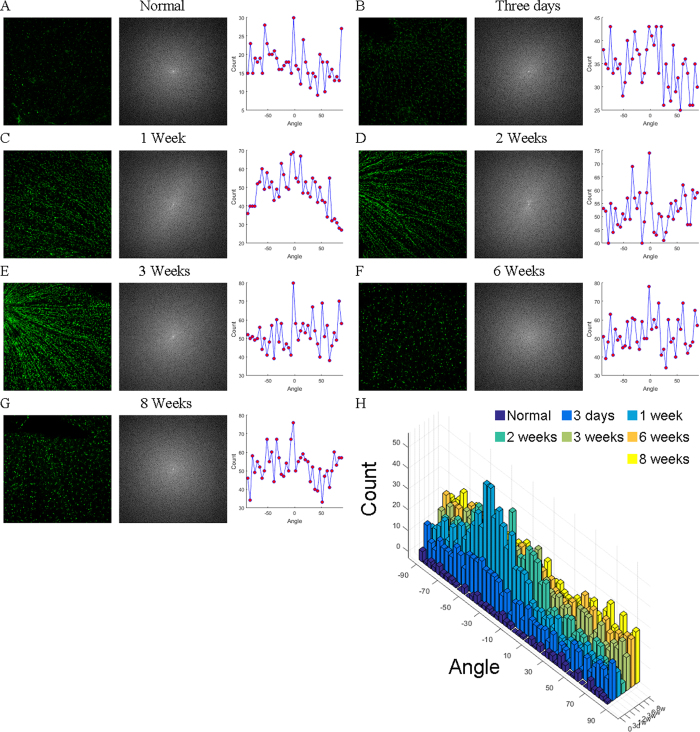
Figure 5. Angle histogram versus time.
The angle distributions of microglia in normal retinas (A), and retinas of 3 days (B), 1 week (C), 2 weeks (D), 3 weeks (E), 6 weeks (F) and 8 weeks (G) after optic nerve transection. H Compares microglial angles of normal retina and the retinas after optical nerve transection.

