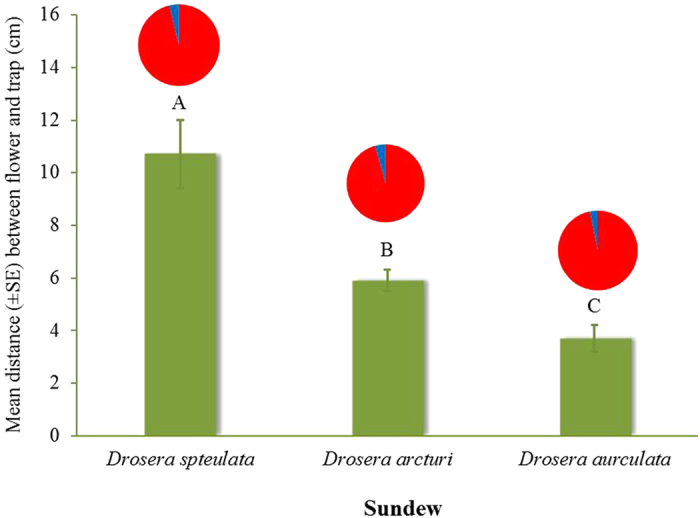
Figure 2. Mean (±SE) distance in cm (N = 15) of spatial separation between flowers and traps in the three sundew species.

Columns labelled with different letters are significantly different (P < 0.001). Pie chart is percentage of flower visitors (blue) of the total number of insects found on traps in the three sundew species.
