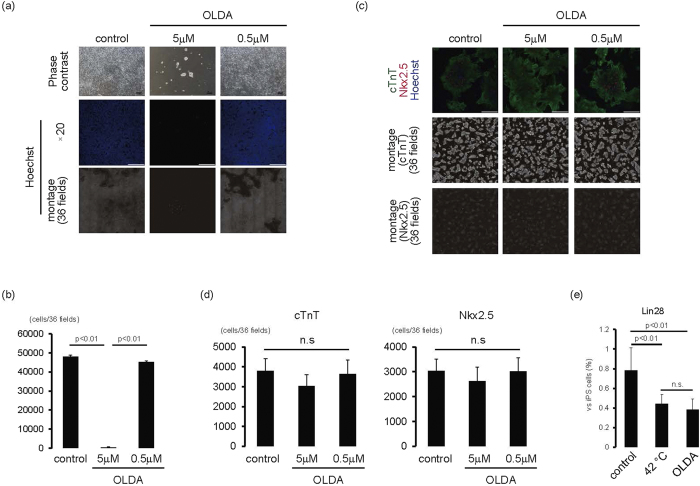
Figure 7. iPS elimination using TRPV-1 agonist.
(a,b) iPS cells on laminin E8 fragment were cultured with OLDA for 1 day. (a) Upper panels are representative of phase-contrast images. Bars, 100 μm. Middle panels, Hoechst staining images. Bars, 200 μm. Lower, montage images of 36 fields (6 × 6) of Hoechst staining images (original magnification of each field is ×20). Multiple images from the same sample were acquired using the same microscope settings. (b) Cell number at each condition was calculated and shown in the graph (n = 3). (c,d) iPS cell-derived cardiac cells were cultured with OLDA for 1 day. (c) Upper, merged images of cTnT (green), Nkx2.5 (red), and Hoechst (blue). Bars, 200 μm. Middle, montage images of 36 fields (6 × 6) of cTnT staining images (original magnification of each field is ×20). Lower, montage images of 36 fields (6 × 6) of Nkx2.5 staining images (original magnification of each field is ×20). Multiple images on cTnT and Nkx2.5 from the same sample were acquired using the same microscope settings. (d) Number of cTnT-positive (left) and Nkx2.5-positive (right) cells. n.s., not significant. (e) iPS cell-derived cardiac cells were cultured at 42 °C or with OLDA (5 μM) at 37 °C for 2 days. The mRNA expression of Lin28 of cardiac cells after cardiac differentiation of human iPS cells (n = 3). Y-axis indicates relative gene expression of Lin28 compared with undifferentiated iPS cells cultured on MEF.

