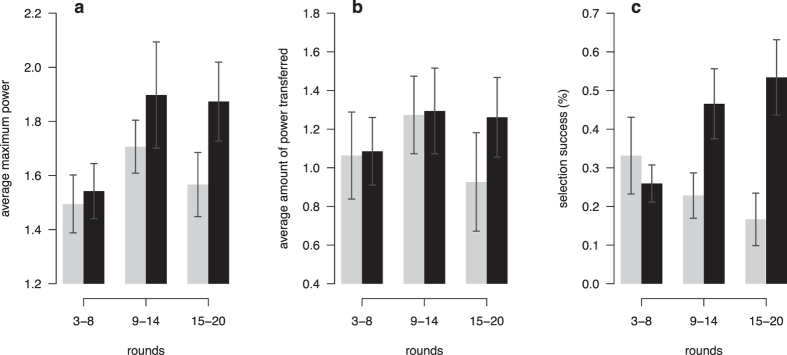
Figure 4. Characteristics of cooperative and non-cooperative groups across time intervals.
Bars depict groups in which cooperation declined (light grey), or increased (dark grey). (a) Power centralisation, measured by the power of the most powerful group member; (b) average amount of power transferred; (c) selection success, measured by the share of rounds in which the most active punisher of non-cooperators of past rounds was the most powerful.

